Question
In: Electrical Engineering
1) What is the minimum value of random samples generated by the following MATLAB code?: 5*(2*rand-1)...
1) What is the minimum value of random samples generated by the following MATLAB code?: 5*(2*rand-1)
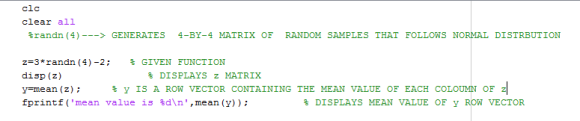
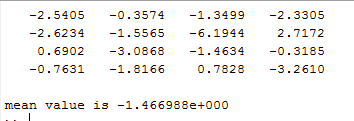
2) What is the mean value of random samples generated by the following MATLAB code?: 3*randn-2
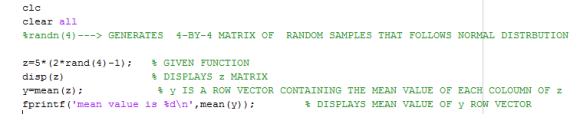
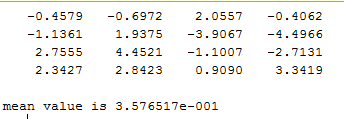
3) What is the mean value of random samples generated by the following MATLAB code?: 5*(2*rand-1)
Solutions
Expert Solution
1) code:-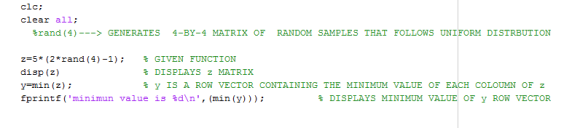
Result:-

2) code:-
Result :-
3) code:-
Result:-
you can change format of output or round it off if needed.
 Manojponduru answered 2 years ago
Related Solutions
Formula=IF(RAND()>0.5,T.INV(RAND(),10)-2,T.INV(RAND(),10)+2 observation sample 1 1 1.37700278 2 1.827378045 3 3.479013387 4 1.382604626 5 2.572039451 6 2.38234939...
Formula=IF(RAND()>0.5,T.INV(RAND(),10)-2,T.INV(RAND(),10)+2
observation
sample 1
1
1.37700278
2
1.827378045
3
3.479013387
4
1.382604626
5
2.572039451
6
2.38234939
7
0.240414349
8
-1.347432349
9
2.85777933
10
-3.379978992
11
-2.746482213
12
1.886442756
13
-1.947527669
14
1.540754548
15
-0.233174876
16
-1.104079702
17
-1.226712691
18
3.300631732
19
0.940368484
20
-1.845113569
21
-1.250733918
22
-1.392547733
23
2.478557615
24
0.823135564
25
1.630991977
sample
mean
0.489827213
Use the excel spreadsheet to simulate 1000 samples of size 25 by
copying cells C:3 through C:27 and pasting into rows 3 through...
Consider the following dependent random samples Observations 1 2 3 4 &
Consider the following dependent random samples
Observations
1
2
3
4
5 6
x-values
8.8 7.9 8.0 8.4
8.2 8.0
y-values 7.7 7.3 8.0
8.9 7.5 7.8
a) Determine the difference between each set of points,
xi - yi
b) Do hypothesis testing to see if µd < 0 at the α
= .025.
Following are two computer-generated random samples of size n=12 from normal populations: sample 1: 31.7, 30.3,...
Following are two computer-generated random samples of size n=12
from normal populations:
sample 1: 31.7, 30.3, 29.3, 30.1, 29.2, 31.5,
28.9, 31.1, 27.6, 29.3, 32.0, 30.9
Sample 2: 29.4, 29.7, 26.7, 28.0, 30.8, 29.8,
28.3, 28.6, 28.2, 29.4, 31.2, 29.8
Use the two-sample t test to test the null hypothesis μ1=μ2
against the alternative hypothesis μ1≠μ2 at the 0.10 level of
significance. State assumptions.
What is the code in Rstudio or R? (a) Generate 200 random samples of size n...
What is the code in Rstudio or R?
(a) Generate 200 random samples of size n = 10 from a Poisson
distribution with mean λ = 12.
i. Calculate sample means for each sample. Report the first 10
sample means.
ii. Draw a histogram of the sample means (where the y-axis is
the density) and fit a density estimate (default density estimator
is ok).
iii. What is your finding about the sampling distribution of the
sample mean, based on your...
MIPS code to calculate The 1- minimum 2- maximum 3- mid value of three number, user...
MIPS code to calculate The 1- minimum 2- maximum 3- mid value of
three number, user will enter the numbers
The following code must be written in Matlab I want to print the following in Matlab...
The following code must be written in Matlab
I want to print the following in Matlab (x1,x2, x3) = (0.33333,
0.33333, 0.33333) . The whole thing should be on the
same line.
I need to use fprintf and write out the coordinates with 5
decimal places of variable x = (0.33333, 0.33333, 0.33333)
Thanks!
This is a Matlab Exercise problem. Please create the Matlab code and figure for the following...
This is a Matlab Exercise problem. Please create the Matlab code
and figure for the following problem using problem
specifications:
Plot x vs y when y=sin(x), y=cos(x), y=sin (2*x), and y=2*sin(x)
when x = 1:0.1:10. Use 2 by 2 subplot, sin(x) is in
location 1, cos(x) is in location 2, sin(2*x) is in location 3 and
2*sin(x) is in location 4.
The plot should have:
(1) x label = ‘x value’, y label = ‘y value’, legend
‘y=sin(x)’,’ y=cos(x)’,’ y=sin...
n following code if variable n=0, a=5 and b=10 then what will be the value of...
n following code if variable n=0, a=5 and b=10 then what will be
the value of variable ‘n’ after while loop executed. Show your
working as well.
while(n<=(a^b)) { n++; } printf("%d",n)
The following results are for independent random samples taken from two populations. Sample 1 Sample 2...
The following results are for independent random samples taken
from two populations.
Sample 1
Sample 2
n1 = 20
n2 = 30
x1 = 22.8
x2 = 20.1
s1 = 2.3
s2 = 4.8
(a) What is the point estimate of the difference between the two
population means? (Use x1 − x2.)
(b) What is the degrees of freedom for the t
distribution? (Round your answer down to the nearest integer.)
(c) At 95% confidence, what is the margin of...
what is the code to solve and graph the following function in matlab dv/dt=80.5(1-e^(.4t))
what is the code to solve and graph the following function in
matlab
dv/dt=80.5(1-e^(.4t))
ADVERTISEMENT
ADVERTISEMENT
Latest Questions
- Two 10-cm-diameter charged rings face each other, 15cm apart. The left ring is charged to -29nC...
- Under what conditions would it be possible for an excise tax to have no efficiency cost...
- explain the difference between activities and financial statements of service businesses and merchandising businesses.
- 2. Compare and compare the matrix multiplication algorithm and the Floyd-Warshall algorithm to find all pairs...
- Q: 50.00 ml of 0.5216 M copper(II) nitrate solution is combined with 100.0 ml of 0.5580...
- This is a business law question. Explain how environmental laws regulate the use of toxic substances...
- A sky diver and her parachute system weigh a total of 800 N. She is falling...
ADVERTISEMENT