Question
In: Economics
Question 3) Consider the discussion in chapter 13 of the Jones textbook; answer the questions below...
Question 3) Consider the discussion in chapter 13 of the Jones textbook; answer the questions below in regard to the slope of the Aggregate Demand curve. (You may use a diagram for parts (b) and (c) to better explain your answer)
a. Why does the AD curve slope downward?
b. If the AD curve were more steeply sloped, how would the economy respond differently to aggregate demand shocks (shocks to ̅)?
c. If the AD curve were more steeply sloped, how would the economy respond differently to aggregate supply shocks (shocks to ̅)?
d. What kind of economic changes in the economy would lead the curve to be more steeply sloped?
(can you answer part (d) for me?)
Solutions
Expert Solution
Ans:-(A)

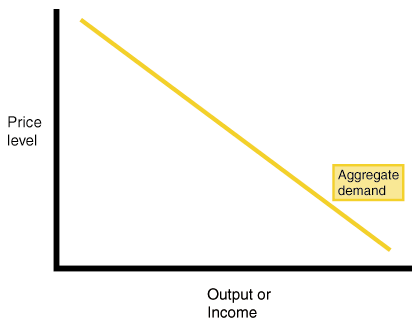
Figure %: Graph of the aggregate demand curve.
The most noticeable feature of the aggregate demand curve is that it is downward sloping, as seen in . There are a number of reasons for this relationship. Recall that a downward sloping aggregate demand curve means that as the price level drops, the quantity of output demanded increases. Similarly, as the price level drops, the national income increases. There are three basic reasons for the downward sloping aggregate demand curve. These are Pigou's wealth effect, Keynes's interest-rate effect, and Mundell-Fleming's exchange-rate effect. These three reasons for the downward sloping aggregate demand curve are distinct, yet they work together.
The first reason for the downward slope of the aggregate demand curve is Pigou's wealth effect. Recall that the nominal value of money is fixed, but the real value is dependent upon the price level. This is because for a given amount of money, a lower price level provides more purchasing power per unit of currency. When the price level falls, consumers are wealthier, a condition which induces more consumer spending. Thus, a drop in the price level induces consumers to spend more, thereby increasing the aggregate demand.
The second reason for the downward slope of the aggregate demand curve is Keynes's interest-rate effect. Recall that the quantity of money demanded is dependent upon the price level. That is, a high price level means that it takes a relatively large amount of currency to make purchases. Thus, consumers demand large quantities of currency when the price level is high. When the price level is low, consumers demand a relatively small amount of currency because it takes a relatively small amount of currency to make purchases. Thus, consumers keep larger amounts of currency in the bank. As the amount of currency in banks increases, the supply of loans increases. As the supply of loans increases, the cost of loans--that is, the interest rate--decreases. Thus, a low price level induces consumers to save, which in turn drives down the interest rate. A low interest rate increases the demand for investment as the cost of investment falls with the interest rate. Thus, a drop in the price level decreases the interest rate, which increases the demand for investment and thereby increases aggregate demand.
The third reason for the downward slope of the aggregate demand curve is Mundell-Fleming's exchange-rate effect. Recall that as the price level falls the interest rate also tends to fall. When the domestic interest rate is low relative to interest rates available in foreign countries, domestic investors tend to invest in foreign countries where return on investments is higher. As domestic currency flows to foreign countries, the real exchange rate decreases because the international supply of dollars increases. A decrease in the real exchange rate has the effect of increasing net exports because domestic goods and services are relatively cheaper. Finally, an increase in net exports increases aggregate demand, as net exports is a component of aggregate demand. Thus, as the price level drops, interest rates fall, domestic investment in foreign countries increases, the real exchange rate depreciates, net exports increases, and aggregate demand increases.
IS-LM model of aggregate demand
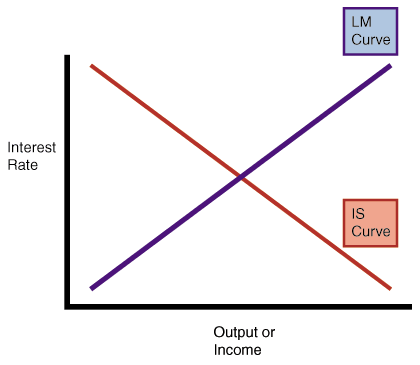
There is another major model that is useful for explaining the nature of the aggregate demand curve. This model is called the IS-LM model after the two curves that are involved in the model. The IS curve describes equilibrium in the market for goods and services where Y = C(Y - T) + I(r) + G and the LM curve describes equilibrium in the money market where M/P = L(r,Y). The IS-LM model exists in a plane with r, the interest rate, on the vertical axis and Y, being both income and output, on the horizontal axis. The IS-LM model has the same horizontal axis as the aggregate demand curve, but a different vertical axis.

Figure %: Graph of the IS-LM curves.
The IS curve describes equilibrium in the market for goods and services in terms of r and Y. The IS curve is downward sloping because as the interest rate falls, investment increases, thus increasing output. The LM curve describes equilibrium in the market for money. The LM curve is upward sloping because higher income results in higher demand for money, thus resulting in higher interest rates. The intersection of the IS curve with the LM curve shows the equilibrium interest rate and price level.
Ans:-(B)
A steeper AS would mean that both output and inflation would fluctuate less for a given oil price shock. (Note that the oil price shock is a y- intercept shock.)
Ans:-(C)
A steeper AS would mean that output would fluctuate less, but inflation would fluctuate more under AD shocks.
Ans:-(D)
Customers willing to tolerate price changes, inflation less sticky
Related Solutions
There is no answer to the Chapter 3 discussion question 13 for Pearsons Federal Taxation 2020....
The question is from the textbook Inequality, Discrimination, Poverty, and Mobility Question 3 from chapter 13:...
Please Answer both parts of the question below Answer the flowing questions that summarize the chapter....
QUESTION 13 Questions 13-15 The information of the numbers of copies of a college textbook sold...
From the textbook Global Marketing by Warren J. Keegan, and Mark C. Green. Chapter 13 Discussion...
Use ILAC format to answer the questions. Question: what is Director's duties (20 marks): (chapter 13...
Please answer the following questions. Answers can be found in Chapter 4 of the textbook and...
13. Consider the specific-factors model and use the following information to answer the questions below: Manufacturing:...
13. Answer the following 3 questions for number 13. What are the benefits accruing to a...
The question is from the textbook Inequality, Discrimination, Poverty, and Mobility Question 3, Chapter 15: "Explain...
- I asked this question before, but I'm wondering if there are any other ways to do...
- Can you please Describe your actions as the Manager, and how you would manage the project...
- Suppose we have a collection of n different subsets of the set { 1, 2, ...,...
- def read_list(): """ This function should ask the user for a series of integer values (until...
- If two slits are separated by .25cm and the slit to screen is 1m, what is...
- Determine the oxidation number (oxidation state) for the indicated element in each of the following compounds....
- What is the difference between product and production risk? How can they be mitigated?
 Rahul Sunny answered 1 year ago