Question
In: Economics
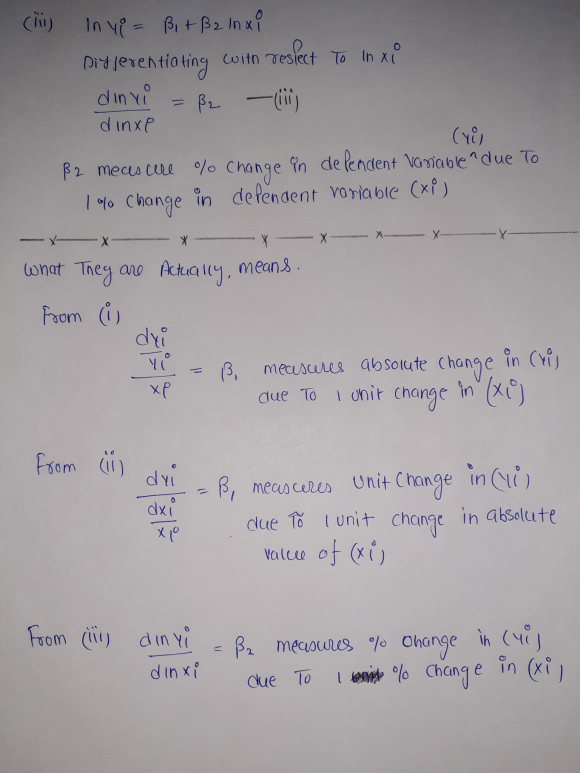
How is the slope coefficient interpreted in a log-linear model, where the dependent variable is (i)...
How is the slope coefficient interpreted in a log-linear model, where the dependent variable is (i) in logarithms but the independent variable is not (i.e. a log-linear model), (ii) in a linear-log model and (iii) in a log-logmodel?
Solutions

 i
hope this would help you thank you !
i
hope this would help you thank you ! Rahul Sunny answered 3 years ago
Related Solutions
how to interpret log-linear coefficient? Follow is the independent variables and their coefficient Dependent variable: EXPORT...
how to interpret log-linear coefficient? Follow is the
independent variables and their coefficient
Dependent variable: EXPORT
Constant= 11.96
Adoption rate=0.03
approval process=5.12
risk assessment=-3.6
labeling = -2.03
international agreement= 0.44
Differences between log linear model and generalized log linear model.
Differences between log linear model and generalized
log linear model.
Suppose you estimate a simple linear regression model and obtain a t-value for the slope coefficient...
Suppose you estimate a simple linear regression model and obtain
a t-value for the slope coefficient of -3.1. Based on this, explain
which of the following statements are correct or wrong:
a) A 95% confidence interval for the true slope would exclude
0.
b) It is possible that the point estimate for the slope is
b_1=4.
c) At the 10% level of significance you fail to reject the null
hypothesis that the true slope is equal to 0.
d) The...
Having data of two independent variables and a dependent variable, how do I plot a linear...
Having data of two independent variables and a dependent
variable, how do I plot a linear graph (trendline fit)? (Linear
equation) Possible to use excel.
I have to do a simple linear regression project. The dependent variable that I chose is...
I have to do a simple linear regression project. The dependent
variable that I chose is international tourist receipts (US$
billions) and the independent variable I chose is International
tourist arrivals in (billions). Did I set up my variables
correctly? I am using data from the World Bank. The main trouble I
am having is why testing the correlation between these two
variables is important and need some ideas on answering the few
questions in the introduction of the essay,...
How do you interpret a regression coefficient, which has log differences as both independent and dependent...
How
do you interpret a regression coefficient, which has log
differences as both independent and dependent variable.
For example, log(y_t+1)-log(y_t) =
alpha+beta{log(x_t+1)-log(x_t)}+......
Is it “1 percent increase in the growth rate of x affects the
growth rate of y by beta percent.”?
1. Explain why the linear probability model is inadequate as a specification for binary dependent variable...
1. Explain why the linear probability model is inadequate as a
specification for binary dependent variable estimation.
2. How can we measure whether the probit and logit model that we
have estimated fits the data well or not?
3. How does R-square for the OLS differ frmo the pseduo R-square
for binary models?
1.Describe the log-linear regression model and how it is used to measure the elasticity of the...
1.Describe the log-linear regression model and how it is used to
measure the elasticity of the dependent variable with respect to an
explanatory variable.
2.Describe how to measure the growth rate of the dependent
variable using the semi-log regression model.
3.Describe the linear trend regression model.
4.Describe the standardized regression model.
1. The Coefficient of Determination is * a. the percent of variance in the dependent variable...
1. The Coefficient of Determination is *
a. the percent of variance in the dependent variable that can be
explained by the independent variable
b. the ratio of the variance of Y to the variance of Y for a
specific X
c. a measure of how strong the linear relationship is between
the explanatory and response variables
2.
The null hypothesis for a regression model is state as *
a. beta_1=0: there is no relationship
b. beta_1 > 0: there...
Your experience tells you that an independent variable is positively correlated to the dependent variable but a multiple regression model give it a negative coefficient.
Your experience tells you that an independent variable is positively correlated to the dependent variable but a multiple regression model give it a negative coefficient. What could cause this? Your judgement is wrong. Statistics don't lie The software package made an error The homoscedasticity assumption has been violated The model may have correlated independent variables The heteroscedasticity assumption has been violated
ADVERTISEMENT
ADVERTISEMENT
Latest Questions
- Power Music owns five music stores, where it sells music, instruments, and supplies. In addition, it...
- 4) A client wants to finance the purchase of a house costing $50,000 over a period...
- [The following information applies to the questions displayed below.] In 2018, Sheryl is claimed as a...
- Show that the acceleration of any object down a frictionless incline that makes an angle theta...
- Do Cell Phones Cause Cancer? In 5-6 sentences in length using information from the article or...
- Visual Basic program in visual studio please Write a function that checks whether a string has...
- Write a memo by answering following questions. Overview: Identify a current topic impacting financial statements or...
ADVERTISEMENT