Question
In: Economics
On the following graph, use the green point (triangle symbol) to plot the annual total revenue when the market price is $30, $45, $60, $75, $90, $105, and $120 per bike.
The following graph shows the daily demand curve for bikes in New York City.
Use the green rectangle (triangle symbols) to compute total revenue at various prices along the demand curve. Note: You will not be graded on any changes made to this graph.

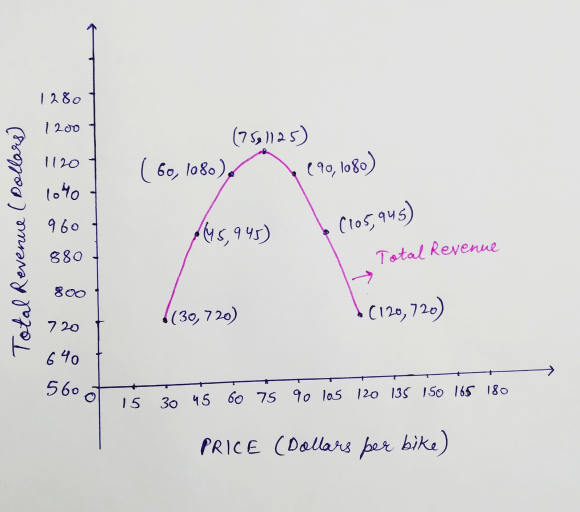
On the following graph, use the green point (triangle symbol) to plot the annual total revenue when the market price is $30, $45, $60, $75, $90, $105, and $120 per bike.

According to the midpoint method, the price elasticity of demand between points A and B is approximately _______
Suppose the price of bikes is currently $30 per bike, shown as point B on the initial graph. Because the demand between points A and B is _______ , a $15-per-bike increase in price will lead to _______ in total revenue per day.
In general, in order for a price decrease to cause a decrease in total revenue, demand must be _______
Solutions
Expert Solution
Total revenue refers to the total amount that a seller gets by selling a particular quantity of a good at a particular price. It is calculated at the product of price and quantity at a given price and quantity.

Total revenue for the various market prices given in the above question can be calculated using the above formula as follows. First of all find the quantities corresponding to the given prices using the first graph.
At P = 30, Q= 24 , 
At P= 45, Q= 21, 
At P= 60, Q= 18, 
At P= 75, Q= 15, 
At P= 90, Q= 12, 
At P= 105, Q= 9, 
At P= 120, Q= 6, 
Now, these annual total revenue can be plot against price in the second graph.
Price elasticity of demand between points A and B by mid point method:
At point A, Quantity, Q1 = 21, Price, P1 = 45
At point B, Quantity, Q2 = 24, Price, P2 = 30
According to the mid point formula,
Price elasticity of demand = 
Price elasticity of demand between point A and B is 


So, the price elasticity of demand between point A and B is (-0.12) .
Price elasticity of demand measures the responsiveness of demand to changes in price of the good.
Here, the negative sign of price elasticity shows that bikes are a normal good because as their price increases, their demand decreases. The magnitude of price elasticity of 0.12 which is less than one shows that bikes has inelastic demand. When the price elasticity is less than 1, then the demand is inelastic or less elastic because as prices change, demand does not change by much. When demand is inelastic, then raising the price of the product, raises the total revenue for the firm.
Suppose price of bikes is currently $30 per bike, shown as point B. Because demand between points A and B is INELASTIC, a $15 per bike increase in price will lead to increase in total revenue per day. Total revenue on moving from point B to point A increases from $720 to $945 as calculated above.
In general, in order for a price decrease to cause a decrease in total revenue, demand must be INELASTIC. Only when demand is inelastic, a fall in price will not lead to a high increase in demand. If the demand would rise by a lot with a decrease in price, then fall in price may actually lead to increase in total revenue for the firm. So only when demand is inelastic, a fall in price will lead to fall in total revenue.
 Rahul Sunny answered 3 years ago
Related Solutions
On the following graph, use the green point (triangle symbol) to plot the annual total revenue when the market price is $30, $45, $60, $75, $90, $105, and $120 per bike.
Price (RM) Quantity demanded (tonnes) Quantity supplied (tonnes) 1 90 30 2 75 45 3 60...
use the following contingency table a b c total 1 15 30 45 90 2 40...
- In what ways would the role of a manager working in a nonstandard international assignment arrangement...
- Write a Bash script called move that could replace the UNIX command mv. 'move' tries to...
- Write program in C language using Pthreads API to simulate the real problem, the Sleeping Teaching...
- HF(g) + H2O(l) = H3O+(aq) + F-(aq) In the following equilibrium in a closed system, indicate...
- : Write a paragraph to reflect on what you have learned about Microsoft access in terms...
- Consider two markets: the market for cat food and the market for dog food. The initial...
- Why is business ethics unavoidable?