Question
In: Statistics and Probability
4. Linear regression question: An experiment carried out to investigate the design of two variables x...
4. Linear regression question: An experiment carried out to investigate the design of two variables x and y as follows: X: 303 313 323 323 333 340 343 353 353 364 Y: .96 .83 .72 .73 .65 .60 .58 .52 .53 .46
a)Draw a scatter plot and list your observations.
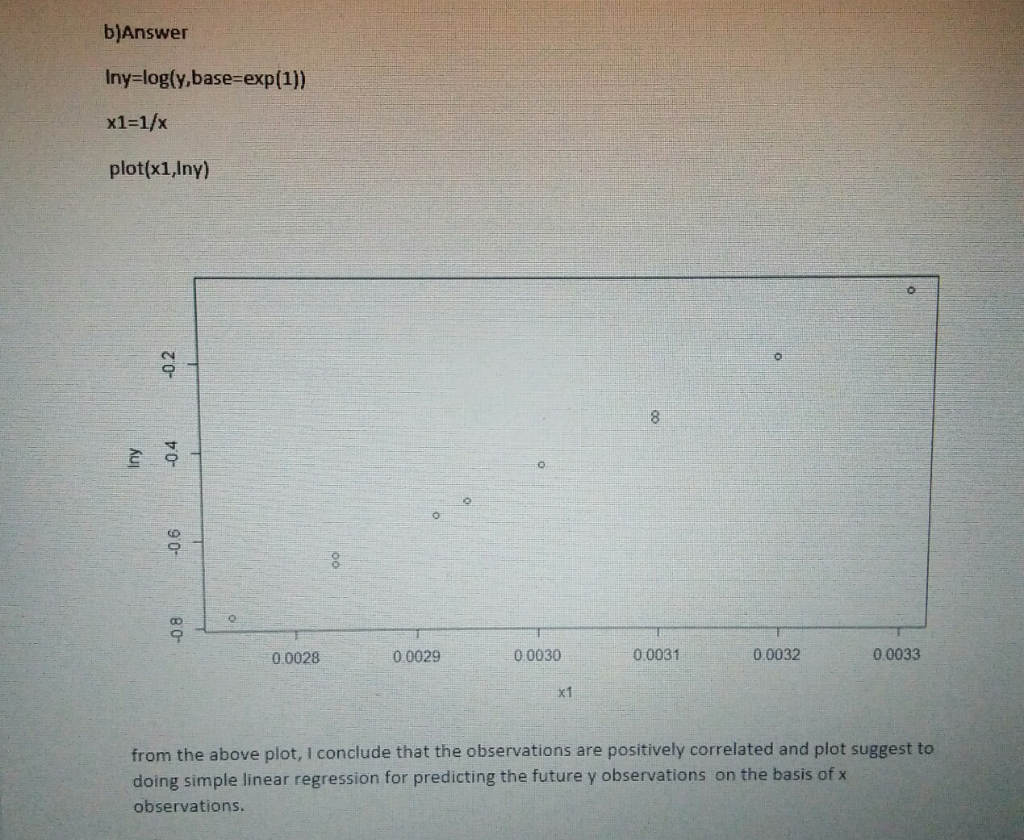
b) Plot ln(y) against 1/x. What does this plot suggest?
c) Fit a straight line to the transformed data of part b and use that line to predict the value of y when x is 325. (10)
Solutions


 orchestra answered 3 years ago
Related Solutions
An experiment was carried out to investigate the effect of species (factor A, with I =...
An experiment was carried out to investigate the effect of
species (factor A, with
I = 4)
and grade (factor B, with
J = 3)
on breaking strength of wood specimens. One observation was made
for each species—grade combination—resulting in SSA = 443.0, SSB =
424.6, and SSE = 125.4. Assume that an additive model is
appropriate.
(a)
Test
H0: α1 =
α2 = α3 =
α4 = 0
(no differences in true average strength due to species)
versus
Ha:...
An experiment was carried out to investigate the effect of species (factor A, with I =...
An experiment was carried out to investigate the effect of
species (factor A, with I = 4) and grade (factor B, with J = 3) on
breaking strength of wood specimens. One observation was made for
each species—grade combination—resulting in SSA = 444.0, SSB =
424.6, and SSE = 122.4. Assume that an additive model is
appropriate. (a) Test H0: α1 = α2 = α3 = α4 = 0 (no differences in
true average strength due to species) versus Ha:...
Question 2: An investigation has been carried out to investigate which of the beverages that two...
Question 2: An investigation has been carried out to investigate
which of the beverages that two separate companies put on the
market is consumed more by consumers. In the first sample of 100
people, the average monthly consumption was 5 liters, in the second
sample of 110 people, the average monthly consumption was 7 liters,
and the standard deviations were 2 and 3 liters, respectively. Test
unilaterally according to the 5% significance level.
Question 1 (18 marks) A pharmaceutical company carried out a study to investigate if men and...
Question 1
A pharmaceutical company carried out a study to investigate if
men and women, of the same age, have different levels of the high
density lipoprotein (HDL) type of cholesterol. This is the type of
cholesterol that is labelled “good” as it helps prevent coronary
disease. A small volunteer sample of men and women aged 40-45 of
general good health was taken as a preliminary trial. Their blood
HDL cholesterol levels (mg/dL) were measured with the following
results:
MALE:...
Question No.1: Solve the following system of two linear equations with two variables x and y...
Question No.1: Solve the following system of two linear
equations with two variables x and y by “Equating the equations”
method. ? = ?? − ?? ??? ? = −? + 5
Question No.2: Is this matrix ? = [ ? ? ? ? ] singular or
non-singular?
Question No. 3: Solve the following operations with the help of
“PEMDAS”. ? ? − (?? ÷ ?) × ? ÷ ? − ? × ? + ?? ÷ ?3
Question No.4:...
When is it inappropriate to use linear regression for measuring the association between two variables?
When is it inappropriate to use linear regression for measuring
the association between two variables?
(Linear combinations). For the purpose of this question, the random variables X and Y are independent...
(Linear combinations). For the purpose of this question, the
random variables X and Y are independent normal X ∼ N(12, 3) and Y
∼ N(15, 4), where the two arguments are the mean and standard
deviation, so the variances are 9 and 16 respectively. If a, b are
two constants, the linear combination aX +bY is normally
distributed with mean 12a + 15b and variance 9a 2 + 16b 2 . Hence
or otherwise, compute the following probabilities:
Part a:...
Given The following results from LINEAR REGRESSION Analysis for the variables X and Y Slope= 12.7...
Given The following results from LINEAR REGRESSION Analysis for
the variables X and Y Slope= 12.7 y-intercept =3.2 n=10 SE=4.3 The
equation of the regression line is …… and 95% confidence interval
for the slope is….
(A)Y=3.2+12.7X, and (3.675,12.768)
(B)Y=12.7+3.2X, and (2.784,12.745)
(C)Y=3.2+12.7X, and (2.784,22.616)
Linear regression question If the range of the x-values are from x=100 to x=150, why might...
Linear regression question If the range of the x-values are
from x=100 to x=150, why might we be reluctant to
use our data to perform a hypothesis test on β0?
Learning Task 12-01 The Enzyme Lactase Experiment Design Which question will your experiment investigate? (select one...
Learning Task 12-01
The Enzyme Lactase Experiment Design
Which question will your experiment investigate? (select one and
delete the others)
How does temperature
affect how lactase drops work to break down lactose into glucose
and galactose?
How does pH affect
how lactase drops work to break down lactose into glucose and
galactose?
How does agitation
(movement) affect how lactase drops work to break down lactose into
glucose and galactose?
What variable will you change in this experiment? This is also...
ADVERTISEMENT
ADVERTISEMENT
Latest Questions
- Calculate the enthalpy of the reaction 4B(s)+3O2(g)?2B2O3(s) given the following pertinent information: B2O3(s)+3H2O(g)?3O2(g)+B2H6(g), ?H?A=+2035 kJ 2B(s)+3H2(g)?B2H6(g),  
- Do you think that CAFTA will have a major impact on the U.S. economy? Why?
- Assignment 4, Fraction Comparable Instructions For this assignment, you will be updating the Fraction class from...
- what crystal claim that English is doing across the world?
- Site map for your e-commerce site. How many webpages this site has? What’s the name of...
- A skier of mass 60 kg starts at the top of a steep slope with an...
- If banks must hold $4 in reserves for each $10 in deposits, and the public decides...
ADVERTISEMENT