Question

In: Economics

Using supply-and-demand diagrams, show the effect of the following events on the market for solar panels....

  1. Using supply-and-demand diagrams, show the effect of the following events on the market for solar panels. Do the following for each example: 1) Explicitly write which curve moves. 3) Explicitly write which direction it moves in. 4) Explicitly write what happens to equilibrium price. 5) Explicitly write what happens to equilibrium quantity. Note: Drawing the diagrams is not required for the exam, but doing so should still help you to answer the question.

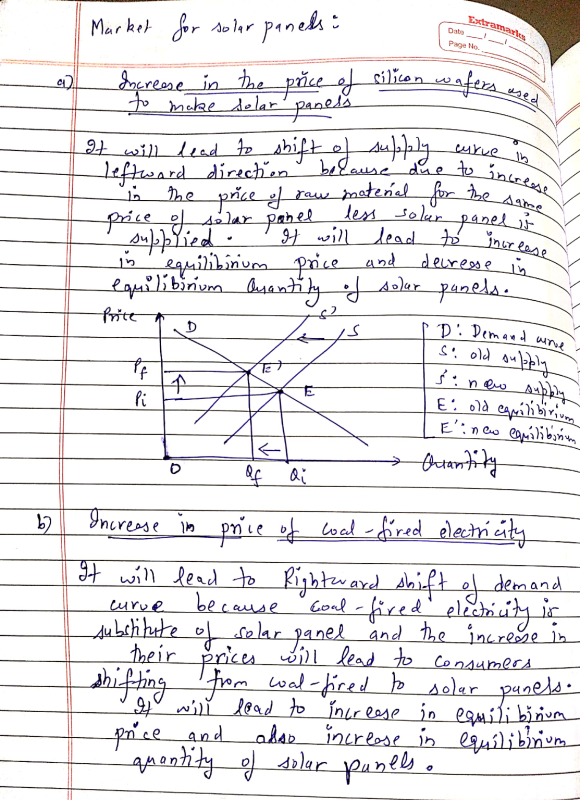
    1. (a) (4 points) There is an increase in the price of silicon wafers used to make solar panels.

    2. (b) (4 points) There is an increase in the price of coal-fired electricity.

    3. (c) (4 points) More Americans want to put solar panels on their rooftops.

    4. (d) (4 points) The technology behind producing solar panels mysteriously becomes worse.

Solutions

Expert Solution


Related Solutions

Using supply and demand diagrams, show the effect of the following events on the market for...
Using supply and demand diagrams, show the effect of the following events on the market for sweatshirts. A hurricane in South Carolina damages the cotton crop. The price of leather jackets falls. All colleges require morning exercise in appropriate attire. New knitting machines are invented. Each original post should include four diagrams with an explanation for each. Respond and engage with at least two of your classmates. NOTE: diagrams can be created using a MS Office product, or drawn by...
1. Using supply-and-demand diagrams, show the effect of the following events on the market of printed...
1. Using supply-and-demand diagrams, show the effect of the following events on the market of printed textbooks. a. A continuous decrease in forests b. The price of electronic textbooks falls. c. Colleges require all students to buy printed textbooks d. New machines to produce printed textbook are invented
Using supply-and-demand diagrams, show the effect of the following events on the market for MRI Scans...
Using supply-and-demand diagrams, show the effect of the following events on the market for MRI Scans (not machines). Indicate the change in equilibrium price and quantity. (Hint: Determine whether Demand or Supply is affected in each case)(10 pts) The price of CT scans increases. Explain the relationship between MRI scans and CT scans. The technology to produce MRI machines improves causing costs to go down. Consumer income falls because of a recession. The number hospitals in areas decreases due to...
Using the appropriate supply and demand diagrams, show why market interest rates are rising when the...
Using the appropriate supply and demand diagrams, show why market interest rates are rising when the economy is expanding.
Consider the market for market for solar panels in Australia 2019 with an upward sloping supply...
Consider the market for market for solar panels in Australia 2019 with an upward sloping supply curve and downward sloping demand curve. The current equilibrium price of solar panels is $250 per panel. Draw a diagram showing the market for solar panel in Australia in 2019. Include and label the demand curve, supply curve, equilibrium price and quantity and the consumer and producer surplus. b. Consider if the government introduces a subsidy to buyers of solar panels of $50 per...
Using the demand and supply diagrams (one for each market), show what short-run changes in price...
Using the demand and supply diagrams (one for each market), show what short-run changes in price and quantity would be expected in the following markets if terrorism-related worries about air safety cause travelers to shy away from air travel. Each graph should contain the original and new demand and supply curves, and the original and new equilibrium prices and quantities. For each market, write one sentence explaining why each curve shifts or does not shift. The market for air travel....
Use a supply and demand diagrams to show that a private health insurance market is inefficient...
Use a supply and demand diagrams to show that a private health insurance market is inefficient in the presence of positive externalities.
1.   Using the supply and demand model, graphically show the effect of each of the following...
1.   Using the supply and demand model, graphically show the effect of each of the following changes on the equilibrium price and quantity in the market for bacon: a.   A decrease in the price of sausage links (explain any assumptions you make). b.   An increase in the price of corn, which is fed to pigs (explain any assumptions you make). c.   An increase in the average income of consumers (explain any assumptions you make). d.   The introduction of a price...
Show the effect of each of the following events on the market for labor in the...
Show the effect of each of the following events on the market for labor in the computer manufacturing industry. a. Congress buys personal computers for all U.S. college students b. More college students major in engineering and computer science c. Computer firms build new manufacturing plants
Using the supply and demand for reserves graphs, show how the following events affects the federal...
Using the supply and demand for reserves graphs, show how the following events affects the federal fund rate, monetary base, non-borrowed reserves, borrowed reserves, the money multiplier, and the money supply. Assume the federal fund rate is equal to the discount rate. The Fed performs an open market sale.
ADVERTISEMENT
ADVERTISEMENT
ADVERTISEMENT