Question
In: Economics
Using supply and demand diagrams, show the effect of the following events on the market for...
Using supply and demand diagrams, show the effect of the following events on the market for sweatshirts.
A hurricane in South Carolina damages the cotton crop.
The price of leather jackets falls.
All colleges require morning exercise in appropriate attire.
New knitting machines are invented.
Each original post should include four diagrams with an explanation for each. Respond and engage with at least two of your classmates. NOTE: diagrams can be created using a MS Office product, or drawn by hand and submitted as an image, or some other product of the student's choice.
Solutions
Expert Solution
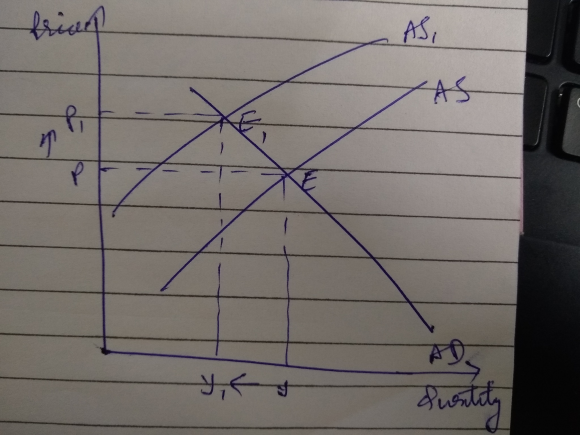
a) Cotton is an input to produce sweatshirt. Damages of cotton crop will raise price of botton which will result in rise in cost of production of sweatshirts. It will induce producers to produce less sweatshirts which will reduce aggregate supply of sweatshirts and shift supply curve backwards from AS to AS1. It will raise price level and reduce output level from P to P1 and Y to Y1 respectively.
b) Fall in price of leather jacket will induce consumers to buy leathers jacket and less of sweatshirts. It will result in downward shift of demand curve of leather jacket which result in fall in price level from P to P1 and output level from Y to Y1.

c) Excercise in proper attire will raise demand of sweatshirts which will shift demand curve to its right. It result in rise in price level from P to P1 and output level from Y to Y1.

d) New knitting machines will help producers in producing more sweatshirts in less time possible. It will induce producers to produce more of sweatshirts and earn maximum profit possible. It will shift supply curve to its right which will reduce price level from P to P1 and output rises from Y to Y1.

 Rahul Sunny answered 3 years ago
Related Solutions
Using supply-and-demand diagrams, show the effect of the following events on the market for solar panels....
1. Using supply-and-demand diagrams, show the effect of the following events on the market of printed...
Using supply-and-demand diagrams, show the effect of the following events on the market for MRI Scans...
Using the appropriate supply and demand diagrams, show why market interest rates are rising when the...
Using the demand and supply diagrams (one for each market), show what short-run changes in price...
Use a supply and demand diagrams to show that a private health insurance market is inefficient...
1. Using the supply and demand model, graphically show the effect of each of the following...
Show the effect of each of the following events on the market for labor in the...
Using the supply and demand for reserves graphs, show how the following events affects the federal...
Describe the effect of each of the following events on either the demand or supply of...
- Two 10-cm-diameter charged rings face each other, 15cm apart. The left ring is charged to -29nC...
- Under what conditions would it be possible for an excise tax to have no efficiency cost...
- explain the difference between activities and financial statements of service businesses and merchandising businesses.
- 2. Compare and compare the matrix multiplication algorithm and the Floyd-Warshall algorithm to find all pairs...
- Q: 50.00 ml of 0.5216 M copper(II) nitrate solution is combined with 100.0 ml of 0.5580...
- This is a business law question. Explain how environmental laws regulate the use of toxic substances...
- A sky diver and her parachute system weigh a total of 800 N. She is falling...