Question
In: Statistics and Probability
To test the Ho: u = 40 versus Hi: u < 40, a random sample of size n = 26 is obtained from a population that is known to be normally distributed.
To test the Ho: u = 40 versus Hi: u < 40, a random sample of size n = 26 is obtained from a population that is known to be normally distributed. Complete (a) through (d).
if x = 36.8 and s = 13.9, compute the test statistic.
to = ??? (round to three decimals as needed)
a) ta = ??? (round to three decimal places. Use a comma to separate answers)
b) If the researcher decides to test this hypothesis at the a = 0.1 level of significance, determine the critical value(s). Although technology or a t-distribution table can be sued to find critical value, in this problem use the t-distribution table given.
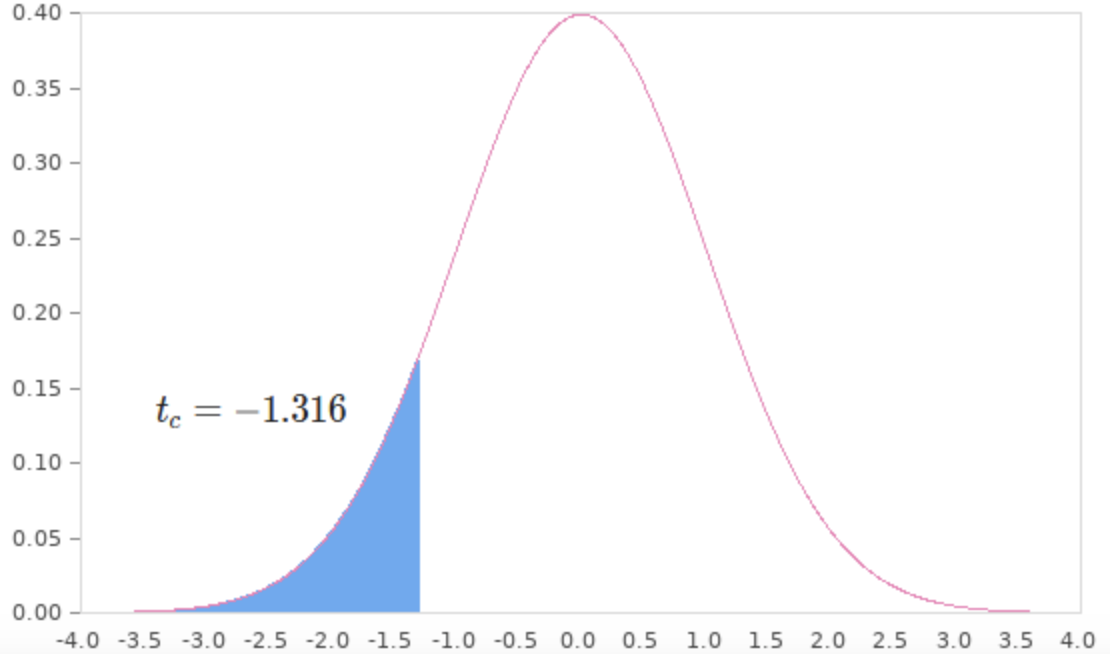
c) Draw a t-distribution that depicts the critical region.
d) Will the researcher reject the null hypothesis?
Yes because the test statistic falls in the critical region
Yes because the test statistic does not fall in the critical region
No because the test statistic does not fall in the critical region
Solutions
Expert Solution
a) From the given information,
\begin{tabular}{|c|c|c|}
\hline \(\bar{x}\) & \(s\) & \(n\) \\
\hline 36.8 & 13.9 & 26 \\
\hline
\end{tabular}
Null hypothesis, \(H_{0}: \mu=40\)
Alternative hypothesis, \(H_{0}: \mu<40\) Calculate the test statistic value
\(t=\frac{\bar{x}-\mu}{s / \sqrt{n}}\)
\(=\frac{36.8-40}{13.9 / \sqrt{26}}\)
\(=1.174\)
Part a The test statistic value is \(1.174 .\)
The test statistic value of the one-sample hypothesis test is 1.174
b)
Level of significance, \(\alpha=0.10\) Calculate the degrees of freedom.
$$ \begin{aligned} d f &=n-1 \\ &=26-1 \\ &=25 \end{aligned} $$
Calculate the \(t-\) critical value.
$$ \begin{aligned} t-\text { critical } &=(=\mathrm{TINV}(0.1,25)) \\ &=-1.316 \quad \text { (Left tail) } \end{aligned} $$
Part \(b\) The critical value is -1.316
The \(t-\) critical value at the 0.10 level of significance with 25 degrees of the freedom is -1.316 (left tailed test).
c)
Construct the critical region graph.

The critical region is less than -1.316
The \(t-\) critical value at the 0.10 level of significance with 25 degrees of the freedom is -1.316 (left tailed test).
d) The correct option is D No because the test statistic does not fall in the critical region.
Part d No because the test statistic does not fall in the critical region.
The test statistic value falls in the critical region, so we reject the null hypothesis and conclude that the alternative
hypothesis is true. That is \(H_{1}: \mu<40\) is true.
The test statistic value is 1.174.
The critical value is -1.316
The critical region is less than -1.316
No, because the test statistic does not fall in the critical region.
Related Solutions
A random sample of size n is taken from a normally distributed population with a population...
Suppose a random sample of size 40 was drawn from a normally distributed population, with a...
A simple random sample of size n is drawn from a population that is normally distributed....
A simple random sample of size n is drawn from a population that is normally distributed....
A simple random sample of size n is drawn from a population that is normally distributed....
A simple random sample of size n is drawn from a population that is normally distributed....
A simple random sample of size n is drawn from a population that is normally distributed....
A simple random sample of size n is drawn from a population that is normally distributed....
A simple random sample of size n is drawn from a population that is normally distributed....
A simple random sample of size n is drawn from a population that is normally distributed....
- 2. a. Choose all of the following that apply to DynamoDB: (a) DynamoDB is part of...
- I asked this question before, but I'm wondering if there are any other ways to do...
- Can you please Describe your actions as the Manager, and how you would manage the project...
- Suppose we have a collection of n different subsets of the set { 1, 2, ...,...
- def read_list(): """ This function should ask the user for a series of integer values (until...
- If two slits are separated by .25cm and the slit to screen is 1m, what is...
- Determine the oxidation number (oxidation state) for the indicated element in each of the following compounds....
 Dr. OWL answered 5 years ago