Question

In: Statistics and Probability

Two different protocols for treating breast cancer were compared. One, called ALND, involves more radical surgery...

Two different protocols for treating breast cancer were compared. One, called ALND, involves more radical surgery (more tissue is removed) with a greater risk of side effects. The other, called SLND, involves less tissue removal and possibly fewer side effects. (There is more detail about this study on p. 526 of Moore, Notz and Fligner, 6th Edition.)

A group of patients is randomly assigned to one or the other treatment and the patients are followed up after five years to see if they are still disease free at that point. The results are summarized in the following table.

Group Sample size Disease free after five years
ALND 420 345
SLND 436 366

Do this study provide evidence significant at the 10% level that the proportions of patients who are cancer free after five years are different under the two treatments?

Formulate H0H0 and HaHa.

a. Give the test statistic:

b. Give the PP-value:

Solutions

Expert Solution

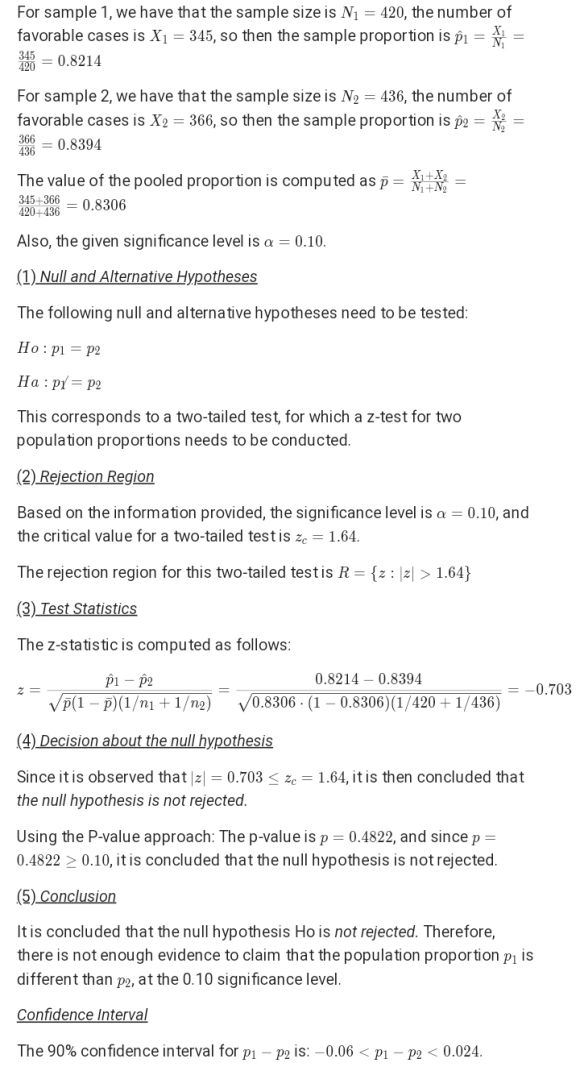
As we fail to reject H0, we conclude that the claim is false that the proportions of patients who are cancer free after five years are different under the two treatments.

Dear student,
I am waiting for your feedback. I have given my 100% to solve your queries. If you satisfied with my answer then please please like this.
Thank You


Related Solutions

One and a half percent (1.5%) of women over 55 have breast cancer. Ninety-two percent (92%)...
One and a half percent (1.5%) of women over 55 have breast cancer. Ninety-two percent (92%) of all women who have breast cancer test positive on mammograms. Nine percent (9%) of women will have false positive mammograms. Define the events: C: {a woman has breast cancer} and +: {the mammogram is positive}. a) Write down what is given in the problem, both explicitly and implicitly, using the events defined in the problem description. b) If a randomly selected woman’s mammogram...
The birth weights for two groups of babies were compared in a study. In one group...
The birth weights for two groups of babies were compared in a study. In one group the mothers took a zinc supplement during pregnancy. In another group, the mothers took a placebo. A sample of 135 babies in the zinc group had a mean birth weight of 3075 grams. A sample of 141 babies in the placebo group had a mean birth weight of 3002 grams. Assume that the population standard deviation for the zinc group is 803 grams, while...
The birth weights for two groups of babies were compared in a study. In one group...
The birth weights for two groups of babies were compared in a study. In one group the mothers took a zinc supplement during pregnancy. In another group, the mothers took a placebo. A sample of 138 babies in the zinc group had a mean birth weight of 3016 grams. A sample of 111 babies in the placebo group had a mean birth weight of 3343 grams. Assume that the population standard deviation for the zinc group is 790 grams, while...
The birth weights for two groups of babies were compared in a study. In one group...
The birth weights for two groups of babies were compared in a study. In one group the mothers took a zinc supplement during pregnancy. In another group, the mothers took a placebo. A sample of 33 babies in the zinc group had a mean birth weight of 3249 grams. A sample of 31 babies in the placebo group had a mean birth weight of 3143 grams. Assume that the population standard deviation for the zinc group is 870 grams, while...
The birth weights for two groups of babies were compared in a study. In one group...
The birth weights for two groups of babies were compared in a study. In one group the mothers took a zinc supplement during pregnancy. In another group, the mothers took a placebo. A sample of 129 babies in the zinc group had a mean birth weight of 3469 grams. A sample of 142 babies in the placebo group had a mean birth weight of 3318 grams. Assume that the population standard deviation for the zinc group is 843 grams, while...
The birth weights for two groups of babies were compared in a study. In one group...
The birth weights for two groups of babies were compared in a study. In one group the mothers took a zinc supplement during pregnancy. In another group, the mothers took a placebo. A sample of 227 babies in the zinc group had a mean birth weight of 3255 grams. A sample of 276 babies in the placebo group had a mean birth weight of 30023002 grams. Assume that the population standard deviation for the zinc group is 708 grams, while...
The birth weights for two groups of babies were compared in a study. In one group...
The birth weights for two groups of babies were compared in a study. In one group the mothers took a zinc supplement during pregnancy. In another group, the mothers took a placebo. A sample of 98 babies in the zinc group had a mean birth weight of 3423 grams. A sample of 80 babies in the placebo group had a mean birth weight of 3004 grams. Assume that the population standard deviation for the zinc group is 686 grams, while...
5 Two different fish attractors were compared during 16 time periods spanning 4 years. (Wilbur, R....
5 Two different fish attractors were compared during 16 time periods spanning 4 years. (Wilbur, R. L. (1978). Two types of fish attractors compared in Lake Tohopekaliga, Florida. Transactions of the American Fisheries Society, 107(5), 689-695.) I present the data as a set of ordered pairs where in each case the first entry is the “pipe attractor” and the second entry is the “brush attractor” {(6.64,9.73), (7.89,8.21),(1.83,2.17),(.42,.75),(.85,1.61),(.29,.75),(.57,.83),(.63,.56),(.32,.76),(.37,.32),(.00,.48),(.11.,.52),(4.86,5.38),(1.80,2.33),(.23,.91,),(.58,.79)} (a)(4 pts) Perform the appropriate paired parameteric t-based test to compare the means....
In a comparison of two different weight-loss programs, obese participants were randomly assigned to one of...
In a comparison of two different weight-loss programs, obese participants were randomly assigned to one of two groups: (1) the soy group, a low-calorie group that ate only soy-based proteins, or (2) the traditional group, a low-calorie group that received 2/3 of their protein from animal products and 1/3 from plant products. One of the dependent measures collected was the amount of body fat loss as a percentage of initial body weight. Summary data from each group based on this...
ADVERTISEMENT
ADVERTISEMENT
ADVERTISEMENT