Question
In: Statistics and Probability
Use a scatterplot and the linear correlation coefficient r to determine whether there is a correlation...
Use a scatterplot and the linear correlation coefficient r to determine whether there is a correlation between the two variables. Use alphaequals0.05. x 6 1 4 8 5 y 5 0 2 7 4 Click here to view a table of critical values for the correlation coefficient. LOADING... Does the given scatterplot suggest that there is a linear correlation? A. Yes comma because the points appear to have a straight line pattern. B. Yes, because the data does not follow a straight line. C. No, because the data follows a straight line. D. No comma because the points do not appear to have a straight line pattern. 0 4 8 12 0 4 8 12 x y x y graph Does the correlation coefficient indicate that there is a linear correlation between the variables? A. No, because the absolute value of the correlation coefficient is greater than the critical value. B. No comma because the absolute value of the correlation coefficient is less than the critical value. C. Yes comma because the absolute value of the correlation coefficient is greater than the critical value. D. Yes, because the absolute value of the correlation coefficient is less than
Solutions
Expert Solution
Does the given scatterplot suggest that there is a linear correlation?
A. Yes, because the points appear to have a straight line pattern.
Explanation:
The scatterplot for the given two variables x and y is given as below:
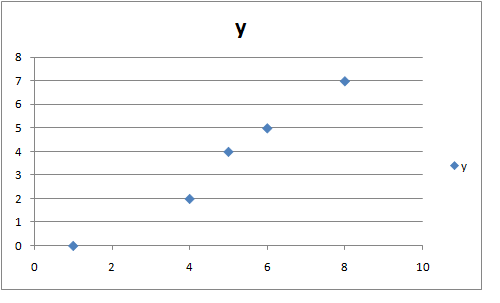
From above scatter plot, it is observed that there is linear relationship exists between the given two variables as the points appear to have a straight line pattern.
Does the correlation coefficient indicate that there is a linear correlation between the variables?
C. Yes, because the absolute value of the correlation coefficient is greater than the critical value.
Solution:
The correlation coefficient between the given two variables is given as 0.986621 (by using excel), this means there is strong positive linear relationship exists between the given two variables.
H0: ρ = 0 versus Ha: ρ ≠ 0
This is a two tailed test.
We are given
Correlation coefficient = r = 0.986621
Level of significance = α = 0.05
n = 5
df = n – 2 = 5 – 2 = 3
So, critical value by using critical value table is given as below:
Critical value = 0.878
Correlation coefficient r = 0.986621 > Critical value = 0.878
So, we reject the null hypothesis
There is sufficient evidence to conclude that the given correlation coefficient is statistically significant.
 orchestra answered 3 years ago
Related Solutions
Use a scatterplot and the linear correlation coefficient r r to determine whether there is a...
Construct a scatterplot, find the value of the linear correlation coefficient r, find the critical value...
Determine and interpret the linear correlation coefficient, and use linear regression to find a best fit...
Given the linear correlation coefficient r and the sample size n, determine the critical values of...
Given the linear correlation coefficient r and the sample size n, determine the critical values of...
Find the correlation coefficient r for the given table below and use it to determine if...
A linear correlation coefficient of 0.92 suggests a ________________ linear relationship than a linear correlation coefficient...
1) Find the correlation coefficient r for the given table below and use it to determine...
1. The linear correlation coefficient r measures of the linear relationship between two variables. (a) Distance...
1. The linear correlation coefficient r measures of the linear relationship between two variables. (a) Distance...
- Dirac's Theorem states that "A simple graph with n vertices (n >= 3) is Hamiltonian if...
- Two 10-cm-diameter charged rings face each other, 15cm apart. The left ring is charged to -29nC...
- Under what conditions would it be possible for an excise tax to have no efficiency cost...
- explain the difference between activities and financial statements of service businesses and merchandising businesses.
- 2. Compare and compare the matrix multiplication algorithm and the Floyd-Warshall algorithm to find all pairs...
- Q: 50.00 ml of 0.5216 M copper(II) nitrate solution is combined with 100.0 ml of 0.5580...
- This is a business law question. Explain how environmental laws regulate the use of toxic substances...