Question
In: Biology
How dk punnet squares model processes, Events, and structures at the cellular level? How do punnett...
How dk punnet squares model processes, Events, and structures at the cellular level?
Solutions
Expert Solution
The Punnett square is a square diagram that is used to predict the genotypes of a particular cross or breeding experiment. It is named after Reginald C. Punnett, who devised the approach. The diagram is used by biologists to determine the probability of an offspring having a particular genotype. The Punnett square is a tabular summary of possible combinations of maternal alleles with paternal alleles.These tables can be used to examine the genotypical outcome probabilities of the offspring of a single trait (allele), or when crossing multiple traits from the parents. The Punnett square is a visual representation of Mendelian inheritance. It is important to understand the terms "heterozygous", "homozygous", "double heterozygote" (or homozygote), "dominant allele" and "recessive allele" when using the Punnett square method. For multiple traits, using the "forked-line method" is typically much easier than the Punnett square. Phenotypes may be predicted with at least better-than-chance accuracy using a Punnett square, but the phenotype that may appear in the presence of a given genotype can in some instances be influenced by many other factors, as when polygenic inheritance and/or epigenetics are at work.

Zygosity
Zygosity refers to the grade of similarity between the alleles that determine one specific trait in an organism. In its simplest form, a pair of alleles can be either homozygous or heterozygous. Homozygosity, with homo relating to same while zygous pertains to a zygote, is seen when a combination of either two dominant or two recessive alleles code for the same trait. Recessive are always lowercase letters. For example, using 'A' as the representative character for each allele, a homozygous dominant pair's genotype would be depicted as 'AA', while homozygous recessive is shown as 'aa'. Heterozygosity, with hetero associated with different, can only be 'Aa' (the capital letter is always presented first by convention). The phenotype of a homozygous dominant pair is 'A', or dominant, while the opposite is true for homozygous recessive. Heterozygous pairs always have a dominant phenotype.To a lesser degree, hemizygosity and nullizygosity can also be seen in gene pairs.
Monohybrid cross
"Mono" means "one"; this cross indicates that the examination of a single trait. This could mean (for example) eye color. Each genetic locus is always represented by two letters. So in the case of eye color, say "B = Brown eyes" and "b = green eyes". In this example, both parents have the genotype Bb. For the example of eye color, this would mean they both have brown eyes. They can produce gametes that contain either the B or the b allele. (It is conventional in genetics to use capital letters to indicate dominant alleles and lower-case letters to indicate recessive alleles.) The probability of an individual offspring's having the genotype BB is 25%, Bb is 50%, and bb is 25%. The ratio of the phenotypes is 3:1, typical for a monohybrid cross. When assessing phenotype from this, "3" of the offspring have "Brown" eyes and only one offspring has "green" eyes. (3 are "B?" and 1 is "bb)
(M = Maternal, P = Paternal)
| P | |||
|---|---|---|---|
| B | b | ||
| M | B | BB | Bb |
| b | Bb | bb |
The way in which the B and b alleles interact
with each other to affect the appearance of the offspring depends
on how the gene products (proteins) interact (see Mendelian
inheritance). This can include lethal effects and epistasis (where
one allele masks another, regardless of dominant or recessive
status)
Dihybrid cross
More complicated crosses can be made by looking at two or more genes. The Punnett square works, however, only if the genes are independent of each other, which means that having a particular allele of gene "A" does not alter the probability of possessing an allele of gene "B". This is equivalent to stating that the genes are not linked, so that the two genes do not tend to sort together during meiosis.
The following example illustrates a dihybrid cross between two double-heterozygote pea plants. R represents the dominant allele for shape (round), while r represents the recessive allele (wrinkled). A represents the dominant allele for color (yellow), while a represents the recessive allele (green). If each plant has the genotype RrAa, and since the alleles for shape and color genes are independent, then they can produce four types of gametes with all possible combinations: RA, Ra, rA, and ra.
| RA | Ra | rA | ra | |
|---|---|---|---|---|
| RA | RRAA | RRAa | RrAA | RrAa |
| Ra | RRAa | RRaa | RrAa | Rraa |
| rA | RrAA | RrAa | rrAA | rrAa |
| ra | RrAa | Rraa | rrAa | rraa |
Since dominant traits mask recessive traits (assuming no epistasis), there are nine combinations that have the phenotype round yellow, three that are round green, three that are wrinkled yellow, and one that is wrinkled green. The ratio 9:3:3:1 is the expected outcome when crossing two double-heterozygous parents with unlinked genes. Any other ratio indicates that something else has occurred (such as lethal alleles, epistasis, linked genes...etc.;).
Forked-line method
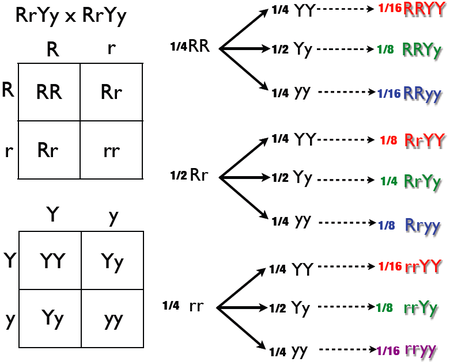
The forked-line method (also known as the tree method and the branching system) can also solve dihybrid and multihybrid crosses. A problem is converted to a series of monohybrid crosses, and the results are combined in a tree. However, a tree produces the same result as a Punnett square in less time and with more clarity. The example below assesses another double-heterozygote cross using RrYy x RrYy. As stated above, the phenotypic ratio is expected to be 9:3:3:1 if crossing unlinked genes from two double-heterozygotes. The genotypic ratio was obtained in the diagram below, this diagram will have more branches than if only analyzing for phenotypic ratio.
 gladiator answered 3 years ago
Related Solutions
Describe the correlation of the following cell structures or cellular processes with the establishment of microbial...
Describe the correlation of the following cell structures or cellular processes with the establishment of microbial...
Describe the correlation of the following cell structures or cellular processes with the establishment of microbial...
what is the least squares model and what statistical support do you have that this model...
Relate the following structures, molecules, events/processes, etc. to transcription and to one another : 1. Introns...
Using the AS-AD model, show how the following events will impact real GDP and price level...
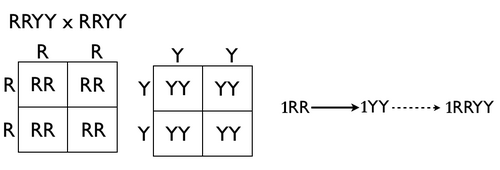
how do you set up a 16 box Punnett square
consider how cellular respiration and photosynthesis are interconnected. thoroughly describe how the processes are similar and...
How can we use the structures that are involved with photosynthesis and cellular respiration to determine...
Explain how the processes of photosynthesis and aerobic cellular respiration are dependent on one another by...
- Hello There, This is discussion Question For Advanced Database Systems Question: (a) Please define what a...
- Physicians at a clinic gave what they thought were drugs to 860860 patients. Although the doctors...
- On January 1, 2018, bonds with a face value of $ 79,000 were sold. The bonds...
- How do I make this sort in true alphabetical order instead of ascii(ABCabc) order? I am...
- As a healthcare provider in physical therapy, athletic training, or as an exercise scientist and personal...
- in the market for makeup artists, what happens after the invention of high-definition tv allowing viewers...
- 10. What are the three monetary policy tools of the Fed? Briefly describe how each tool...