Question

In: Statistics and Probability

The data show the time intervals after an eruption​ (to the next​ eruption) of a certain...

The data show the time intervals after an eruption​ (to the next​ eruption) of a certain geyser. Find the regression​ equation, letting the first variable be the independent​ (x) variable. Find the best predicted time of the interval after an eruption given that the current eruption has a height of 126 feet. Use a significance level of 0.05.

Height (ft)   Interval after (min)
84   76
122   77
78   67
108   87
73   61
105   77
122   87
78   70

What is the regression​ equation?

What is the best predicted time for the interval after an eruption that is 126 feet​ high?

Solutions

Expert Solution

Solution:

From given data , we prepare a table.

X Y XY X^2 Y^2
84 76 6384 7056 5776
122 77 9394 14884 5929
78 67 5226 6084 4489
108 87 9396 11664 7569
73 61 4453 5329 3721
105 77 8085 11025 5929
122 87 10614 14884 7569
78 70 5460 6084 4900
n 8
sum(XY) 59012.00
sum(X) 770.00
sum(Y) 602.00
sum(X^2) 77010.00
sum(Y^2) 45882.00
b 0.3691
a 39.7230

Now ,

Slope of the regression line is
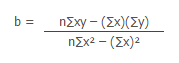
b = 0.3691

Now , y intercept of the line is
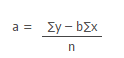
a = 39.7230

The equation of the regression line is

= a + bx

Answer: = 39.7230 +0.3691X

For x = 126 , find the predicted value of y .

Put x = 126 in the regression line equation.

= a + bx

= 39.7230 + (0.3691 * 126)

Answer: y = 86.2296


Related Solutions

The data show the time intervals after an eruption​ (to the next​ eruption) of a certain...
The data show the time intervals after an eruption​ (to the next​ eruption) of a certain geyser. Find the regression​ equation, letting the height of the current eruption be the explanatory variable​ (denoted by​ x). Then use this equation to determine the predicted length of the time interval after an eruption given that the current eruption has a height of 113feet. Height (ft), Interval after (min) 96 66 128 85 75 59 128 86 88 70 73 75 80 73...
The data show the time intervals after an eruption (to the next eruption) of a certain...
The data show the time intervals after an eruption (to the next eruption) of a certain geyser. Find the regression equation, letting the first variable be the independent (x) variable. Find the best predicted time of the interval after an eruption given that the current eruption has a height of 120 feet. Use a significance level of 0.05. Height (ft) Height (ft)   Interval after (min) 96   68 111   80 76   66 91   72 66   58 108   79 116   84 91  ...
The data show the time intervals after an eruption​ (to the next​ eruption) of a certain...
The data show the time intervals after an eruption​ (to the next​ eruption) of a certain geyser. Find the regression​ equation, letting the first variable be the independent​ (x) variable. Find the best predicted time of the interval after an eruption given that the current eruption has a height of 149 feet. Use a significance level of 0.05. Height​ (ft) 136 140 134 144 102 109 104 116 Interval after​ (min) 83 84 94 92 67 67 84 84. What...
The data show the time intervals after an eruption​ (to the next​ eruption) of a certain...
The data show the time intervals after an eruption​ (to the next​ eruption) of a certain geyser. Find the regression​ equation, letting the first variable be the independent​ (x) variable. Find the best predicted time of the interval after an eruption given that the current eruption has a height of 148 feet. Use a significance level of 0.05. Height (ft) Interval after (min) 136 83 140 84 134 94 144 92 102 67 109 67 104 84 116 84
The eruption height and the time interval after eruption of a geyser were measured and are...
The eruption height and the time interval after eruption of a geyser were measured and are shown below. Answer parts ​a-c. Height (x)   Interval after (y) 140   75 130   71 115   59 140   73 112   64 110   56 100   54 120   68 a. Find the value of the linear correlation coefficient r. b. Find the critical values of r from the table showing the critical values for the Pearson correlation coefficient using α=0.05 c. Is there sufficient evidence to conclude...
The eruption height and the time interval after eruption of a geyser were measured and are...
The eruption height and the time interval after eruption of a geyser were measured and are shown below. Answer parts ​a-c. Height​ (x) 125 135 85 95 100 95 115 105 Interval after​ (y) 58 62 40 45 47 48 57 50 a. Find the value of the linear correlation coefficient r. b. Find the critical values of r from the table showing the critical values for the Pearson correlation coefficient using alpha=0.05. c. Is there sufficient evidence to conclude...
For a certain river, suppose the drought length Y is the number of consecutive time intervals...
For a certain river, suppose the drought length Y is the number of consecutive time intervals in which the water supply remains below a critical value y0 (a deficit), preceded by and followed by periods in which the supply exceeds this critical value (a surplus). An article proposes a geometric distribution with p = 0.409 for this random variable. (Round your answers to three decimal places.)(a) What is the probability that a drought lasts exactly 3 intervals? At most 3...
For a certain river, suppose the drought length Y is the number of consecutive time intervals...
For a certain river, suppose the drought length Y is the number of consecutive time intervals in which the water supply remains below a critical value y0 (a deficit), preceded by and followed by periods in which the supply exceeds this critical value (a surplus). An article proposes a geometric distribution with p = 0.385 for this random variable. (Round your answers to three decimal places.) (a) What is the probability that a drought lasts exactly 3 intervals? At most...
Data from service records show that the time to repair a certain machine is normally distributed with a mean of 65 min
Data from service records show that the time to repair a certain machine is normally distributed with a mean of 65 min and a standard deviation of 5 min. Estimate how often it will take more than 75 min to repair a machine.
The data below shows the duration of eruption (in seconds) of a geyser in a national...
The data below shows the duration of eruption (in seconds) of a geyser in a national park and the height (in feet) of the eruptions for a typical day. Use Excel to find the best fit linear regression equation, where duration of eruption is the explanatory variable. Round the slope and intercept to one decimal place. Duration   Height 240   140 237   154 122   140 267   140 113   160 258   140 232   150 105   150 186   160 248   155 243   125...
ADVERTISEMENT
ADVERTISEMENT
ADVERTISEMENT