Question
In: Statistics and Probability
The purpose of this assignment is to calculate and interpret an ANOVA table. For this assignment,...
The purpose of this assignment is to calculate and interpret an ANOVA table. For this assignment, use IBM SPSS Statistics.
Part 1:
Using the "Example Dataset," assess this statement using ANOVA: "People with different levels of education exercise for different amounts of time during the week."
Select and conduct the appropriate ANOVA test to assess the statement. Export the ANOVA table to a Word document.
Part 2:
In 250-500 words, discuss the following regarding the use of ANOVA.
- Describe when the use of ANOVA is more appropriate than the use of a t-test.
- Describe which ANOVA test you used and why.
- Interpret the results by (a) stating the reason the study or
test was done; (b) presenting the main results, including
explaining the within and between subjects variation and the
F-ratio from the ANOVA table; (c) explaining what the results mean,
including discussing whether there is a statistically significant
difference between education groups and amount of exercise; and (d)
making suggestions for future research.
Sex Education_Level*** Minutes_Exercise Female 2 90 Male 2 50 Female 3 65 Male 1 20 Female 1 50 Female 2 25 Female 3 110 Male 1 50 Female 2 40 Male 2 80 Female 3 120 Male 1 80 Female 1 60 Male 3 150 Male 2 75 Male 1 80 Female 2 110 Male 3 80 Male 2 100 Female 1 0 Female 2 50 Female 3 200 Male 2 60 Male 1 65 Female 1 40 Male 3 65 Female 3 70 Female 1 45 Male 3 75 Male 3 50
Solutions
Expert Solution
Solution:
Part 1:
Null hypothesis: There is a no statistically significant difference between education groups and amount of exercise
Alternative hypothesis: There is a statistically significant difference between education groups and amount of exercise
Results are summarized below:
Part 1:
Null hypothesis: There is a no statistically significant difference between education groups and amount of exercise
Alternative hypothesis: There is a statistically significant difference between education groups and amount of exercise
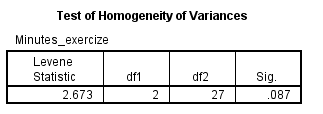
We can observe from table p-value is greater than level of significance 0.05 therefore; we do not reject the null hypothesis of equal variances. Assumption of homogeneity of variances satisfied for performing ANOVA.

P-value is less than level of significance 0.05 therefore we reject the null hypothesis and conclude that there is statistically significant difference between three education level and amount of exercise.
Part 2:
ANOVA test is used when we want to compare more than two or more unrelated groups, whereas two sample t-test is used when we want compare two independent groups.
We have used here, One way ANOVA because researcher wants to check whether there is a statistically significant difference between education groups and amount of exercise. Here we have only one factor or independent variable. A one-way ANOVA only involves one factor or independent variable, whereas there are two independent variables in a two-way ANOVA. ... In a one-way ANOVA, the one factor or independent variable analyzed has three or more categorical groups. A two-way ANOVA instead compares multiple groups of two factors
In given Problem, We want to analyze is there statistically significant difference between three different education level considering amount of exercise. Amount of exercise differs between three education levels or not.
From the ANOVA table we can see between group variability is low compared to within group variability. F-ratio is 5.21 and table value of F at 0.05 for DF1=2 and DF2=29 is 3.32 i.e F-ratio is greater than F-table value therefore; we reject the null hypothesis of equal groups.
From the above results we can reveal that amount of exercise differs between three education levels.
We can study with more data is amount of exercise differs between Males and females with different education levels.
 orchestra answered 3 years ago
Related Solutions
Policy Drivers The purpose of this assignment is to practice and demonstrate your ability to interpret...
1. Use the following table to calculate the correlation coefficient (r). and Interpret the results...
1. Using the information in the table below, calculate the Index of Segregation by occupation. Interpret...
Calculate the F* ratio and write the complete ANOVA table for this data set. do by...
Purpose of Assignment The purpose of this assignment is to allow the students to understand and...
1- What is the purpose of ANOVA ? 2- What are the assumptions of ANOVA? 3-...
Question 1 a) For the data in Homework 2, Question 1, calculate the ANOVA table. Use...
Purpose of Assignment The purpose of this assignment is to allow the students to become familiar...
Rate of Return for Stocks and Bonds Purpose of Assignment The purpose of this assignment is...
Purpose of Assignment The purpose of this assignment is to allow students the opportunity to research...
- Example: We are looking at the cholesterol levels of population of 200 healthy individuals. Cholesterol of...
- In an experiment on the Reaction of Magnesium with Hydrochloric Acid. What would be the effect...
- sort_employees(Employee emps[], int size) (40 pts) This function should sort the input array based on each...
- Write the program in JAVA. Make an undirected, but disconnected graph of at least 15 vertices...
- Teen Smoking Project CHAPTER 0. Preliminary Discussion Question: 1. What conjectures (educated guesses) could be made...
- In reviewing firm liquidity situations, lenders often count on the Quick Ratio (or Acid-Test ratio). Why...
- code a Java program that: Requests from the user for a text filename to read the...