Question
In: Math
only 2 questions ((PLSS with steps and clear hand written PLSSS and thank you sooooo much...
only 2 questions
((PLSS with steps and clear hand written PLSSS and thank you sooooo much for helping me))
| Depression | Geographic location | Gender |
| 3 | Florida | Female |
| 7 | Florida | Male |
| 7 | Florida | Female |
| 3 | Florida | Female |
| 8 | Florida | Female |
| 8 | Florida | Male |
| 8 | Florida | Male |
| 5 | Florida | Female |
| 5 | Florida | Male |
| 2 | Florida | Female |
| 6 | Florida | Female |
| 2 | Florida | Female |
| 6 | Florida | Female |
| 6 | Florida | Male |
| 9 | Florida | Female |
| 7 | Florida | Male |
| 5 | Florida | Male |
| 4 | Florida | Male |
| 7 | Florida | Female |
| 3 | Florida | Female |
| 8 | New York | Female |
| 11 | New York | Male |
| 9 | New York | Male |
| 7 | New York | Male |
| 8 | New York | Female |
| 7 | New York | Male |
| 8 | New York | Female |
| 4 | New York | Male |
| 13 | New York | Female |
| 10 | New York | Male |
| 6 | New York | Female |
| 8 | New York | Female |
| 12 | New York | Female |
| 8 | New York | Male |
| 6 | New York | Male |
| 8 | New York | Male |
| 5 | New York | Male |
| 7 | New York | Female |
| 7 | New York | Male |
| 8 | New York | Male |
| 10 | North Carolina | Male |
| 7 | North Carolina | Female |
| 3 | North Carolina | Male |
| 5 | North Carolina | Male |
| 11 | North Carolina | Female |
| 8 | North Carolina | Female |
| 4 | North Carolina | Male |
| 3 | North Carolina | Male |
| 7 | North Carolina | Female |
| 8 | North Carolina | Male |
| 8 | North Carolina | Female |
| 7 | North Carolina | Female |
| 3 | North Carolina | Female |
| 9 | North Carolina | Female |
| 8 | North Carolina | Female |
| 12 | North Carolina | Female |
| 6 | North Carolina | Male |
| 3 | North Carolina | Male |
| 8 | North Carolina | Male |
| 11 | North Carolina | Female |
As part of a long-term study of individuals 65 years of age or older, sociologists and physicians at the Wentworth Medical Center in upstate New York investigated the relationship between geographic location, gender and depression. A sample of 60 individuals, all in reasonably good health, was selected; 20 individuals were residents of Florida, 20 were residents of New York, and 20 were residents of North Carolina. Each of the individuals sampled was given a standardized test to measure depression. The data collected follow; higher test scores indicate higher levels of depression.
........
l) Is the depression in gender affect by the Geographic locations? Use a 0.05 level of significance.
m)
locations (Florida) (New York) North Carolina
Number of depressed (23for Florida ) (17for NY) (20for North C)persons
Is the distribution of the depressed peoples across locations uniform
(?FL = 33%, ?NY = 33%, ? NC= 33% )? Use a 0.05 level of significance.
Solutions
Expert Solution
h) Based on the given data, our objective is to compare the depression levels of people across three different geographical areas . Let denote the mean depression levels of people from - Florida, New York and North Carolina respectively.
To test: Vs Ha: Not all means are equal
The appropriate test here, would be One way ANOVA. To run the
test, using excel, we must first arrange the dat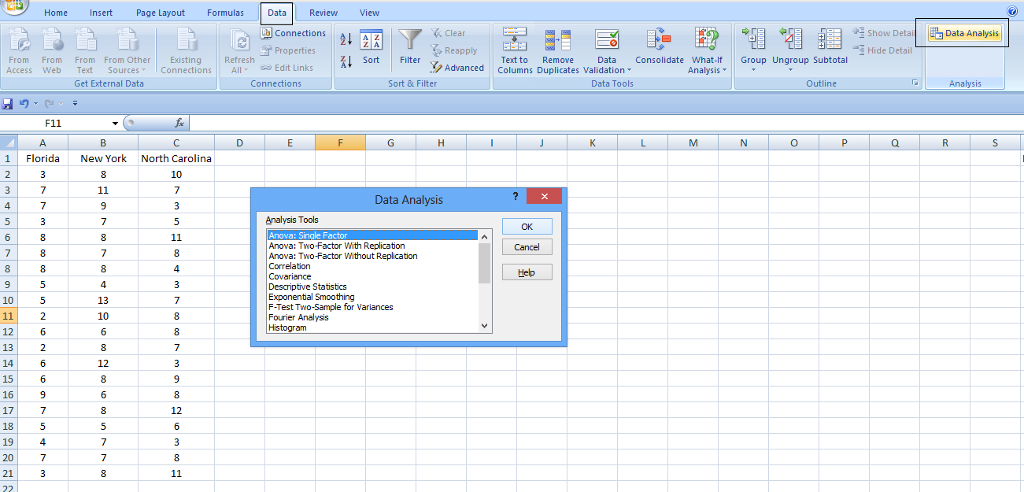
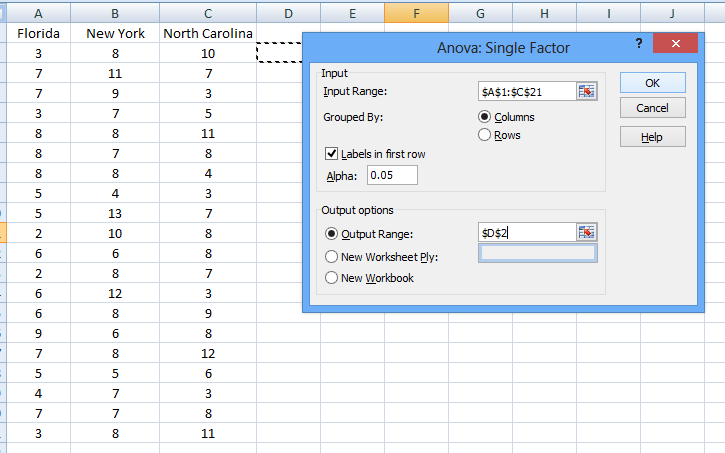
 a in the following man
ner:
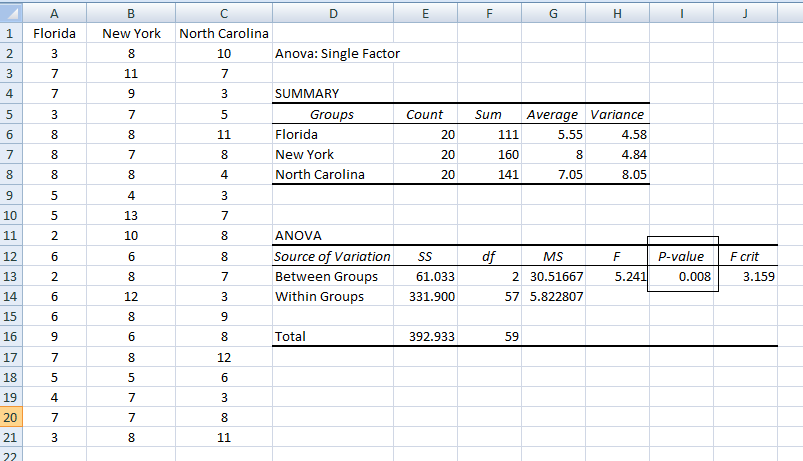
Since the p-value of the test 0.008 < 0.05, we find that the test result is significant. We do not have sufficient evidence to support the null hypothesis. We may reject H0 at 5% level of significance.
We may conclude that not all three means are equal i.e, there is
a significant difference of the mean of depression value due to
geographic location.stimated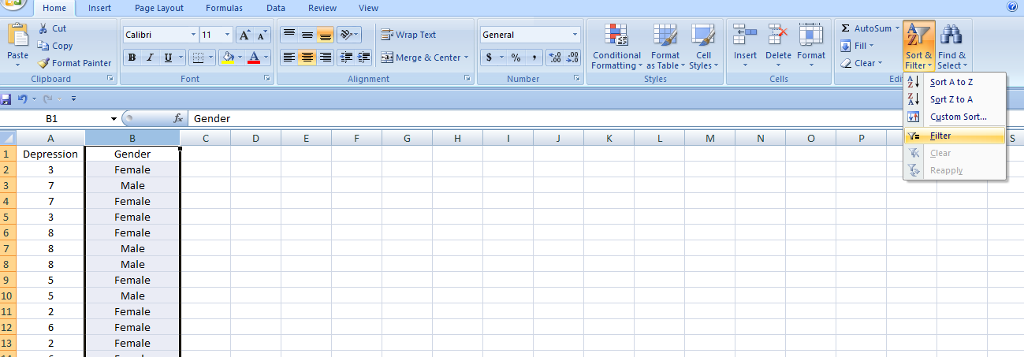
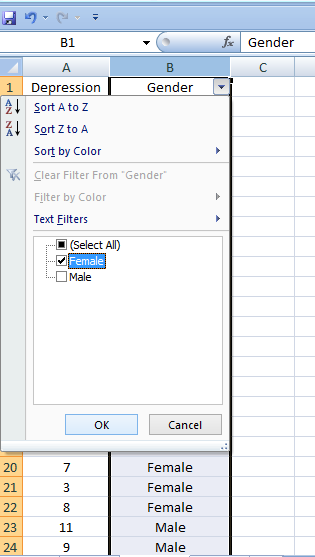
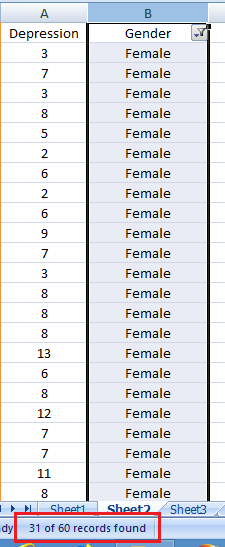
stimated proportion of females = No. of females in the given sample / Total no. of individuals in the given sample
= 31 / 60
=
Similarly,
Estimated proportion of males = No. of males in the given sample / Total no. of individuals in the given sample
= 29 / 60
=
stimated proportion of females = No. of females in the given sample / Total no. of individuals in the given sample
= 31 / 60
=
Similarly,
Estimated proportion of males = No. of males in the given sample / Total no. of individuals in the given sample
= 29 / 60
=
stimated proportion of females = No. of females in the given sample / Total no. of individuals in the given sample
= 31 / 60
=
Similarly,
Estimated proportion of males = No. of males in the given sample / Total no. of individuals in the given sample
= 29 / 60
=
 milcah answered 4 weeks ago
Related Solutions
only 2 questions ((PLSS with steps and clear hand written PLSSS and thank you sooooo much...
Please answer these questions clearly in hand written, thank you! 1. Explain 4 things you can...
((Note: The answer has to be typed, not hand written nor a picture.)) Thank you. ...
(Note: The answer has to be typed, not hand written nor a picture.) Thank you. How...
Please Show Work Typed On Computer Not Hand Written. Thank you! __________________________________________________________________________ Question 10 Quiet Corp....
**Please answer with full steps, thank you so much! A firm is debating whether or not...
*will someone please explain/show the steps in this process for me? Thank you so much! Amy...
Need answers in clear hand writing notes. If you can then attempt my questions other wise...
Need answers in clear hand writing notes. If you can then attempt my questions other wise...
Need answers in clear hand writing notes. If you can then attempt my questions other wise...
- A 244 g mass is hung on a spring. As a result the spring stretches 20.5...
- I'm trying to Generate number every 3 seconds and update the currenet number.I'm able to generate...
- a sulfide of iron, containing 36.5% S by mass, is heated in O2(g), and the products...
- Python previous function: wrtie a function that takes one argument. The function returns True if the...
- A professional couple wishes to purchase a new home costing $750,000, make a 20 percent down...
- Padre holds 100 percent of the outstanding shares of Sonora. On January 1, 2016, Padre transferred...
- Question: Use backtracking algorithm design to write Java code to solve the subset problem: given a...