Question
In: Economics
3. Suppose economy is producing the full employment level of output $22 trillion and unemployment rate...
3. Suppose economy is producing the full employment level of output $22 trillion and unemployment rate is at its natural rate of 4.5%. Now assume that the central bank unexpectedly increases money supply by 10%.
a) Illustrate the short-run effects of the monetary policy by using aggregate demand-aggregate supply model. Be sure to indicate the direction of change in real GDP, the price level and the unemployment rate.
b) Illustrate the long-run effects of the monetary policy by using aggregate demand-aggregate supply model. Again, be sure to indicate the direction of change in real GDP, the price level and the unemployment rate.
c) Now assume that this monetary expansion was completely expected. Illustrate both short-run and long-run effects on the economy by using aggregate demand-aggregate supply model. Again, be sure to indicate the direction of change in real GDP, the price level and the unemployment rate.
Solutions
Expert Solution
Ans:a and b)
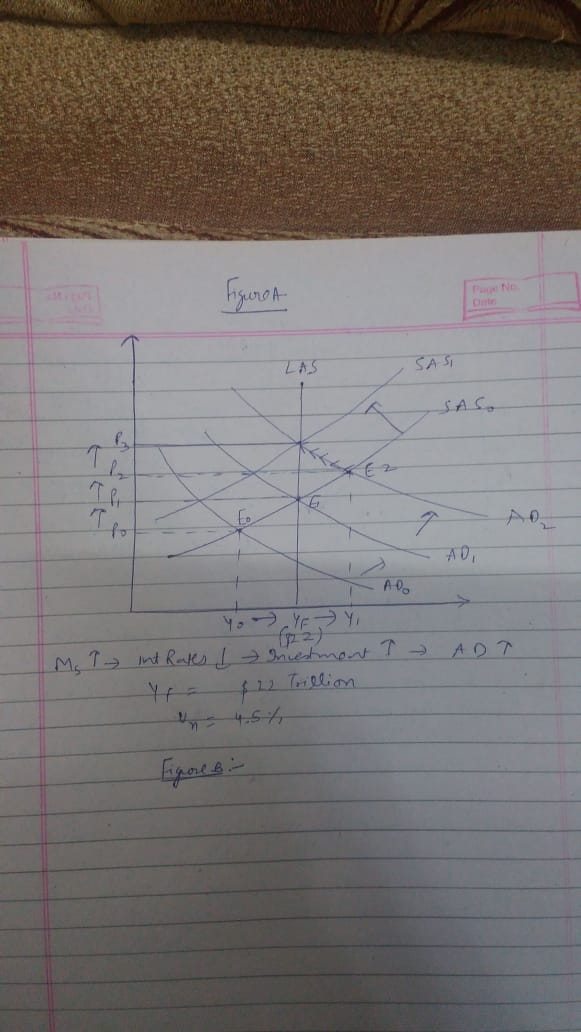
If in figure A, we assume that economy is operating at below full employment level and is in recession .Hence if now money supply is increased,interest rates will fall and aggregate demand will increase and will shift to AD1 from AD0 and prices will increase from P0 to P1. Now if Money supply is increased more and because of which AD will shift towards further right to AD2. and prices will be increasing further to P2.
Now workers will realize that their real wages are reducing which is W/P,hence they will demand more money wages.Hence because of which prices will increase further to P3 ,Short run aggregate supply will be shifting leftwards to SAS1,and money wage rates will be increasing.All this will happen gradually showing by the arrow in the diagram.
In the short run,output can be more than the full employment level of output which is Yf as shown in diagram and unemployment will be even less than its natural rate which is given 4.5% to us in the question.
But in long run,both output and employment will be at its natural level.
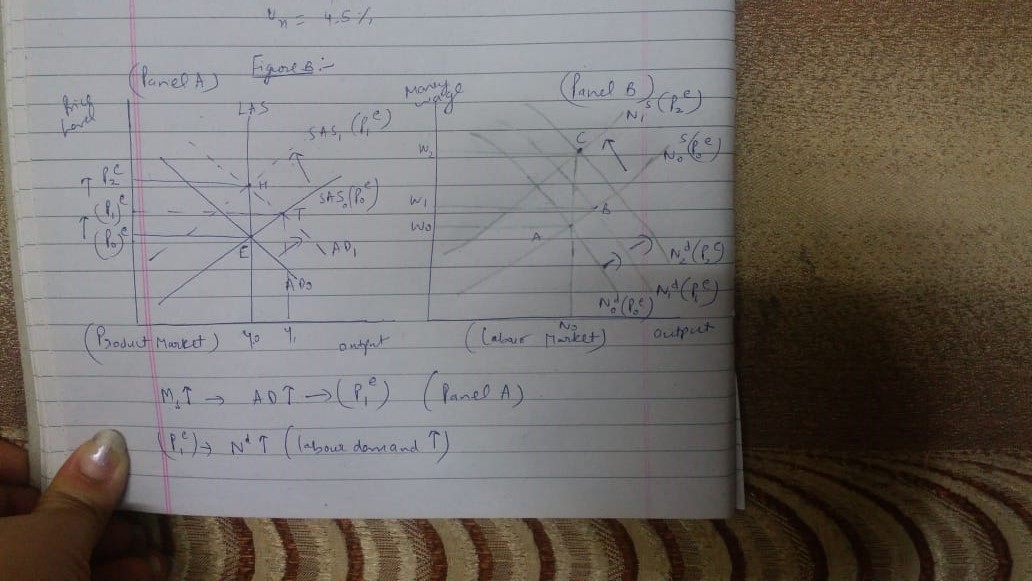
c)In the diagram below, two panels are here .panel A showing product market and panel B showing labor market. In panel A,money supply is increased because of which AD will shift to AD1. As a result, price level rises to P1 superscript e in panel A. In panel B,with rise in price level labor demand curve will shifts rightwards shown by arrow in diagram and intersecting labour supply curve at point b in panel B. Now as people are aware of the monetary policy changes,they will reduce their labour supply and labour supply curve will shift upwards in panel B and because of which aggregate supply curve will shift to SAS1 in panel A. and price will increase to P2 Because of which again labour demand will increase and will shift right and intersecting the Labour supply curve at point C which again leads to increase in wages till W2.This will continue until the new equlibrium is achieved in the labour market where the output and labour employment will be at its original level and wage rate rises to the same extent as the rise in the price level.
 Rahul Sunny answered 1 month ago
Related Solutions
When the economy is at its full employment level, is the unemployment rate zero? Justify your...
Is the definition of full employment the optimal natural rate of unemployment (3%) or is it...
Draw an economy operating (SRAS=AD) below the full employment level of output. if the above economy...
3rd year Macroeconomics Question (a) Suppose that output is at the full-employment level and that nominal...
Advanced Macroeconomics Suppose that output is at the full-employment level and that nominal wages are slow...
A) The full employment level of RGDP is the absolute highest level of output that the...
Suppose an economy is currently at full employment and that the nominal exchange rate is fixed....
An economy has full-employment output of 1500. Suppose desired consumption and desired investment are ? ?...
An economy has full-employment output of 1500. Suppose desired consumption and desired investment are ?? =...
What is the difference between cyclical unemployment, full employment, and the natural rate of unemployment?
- Graph a Monopoly. Compare the price, quantity, and ATC of a monopoly with a perfectly competitive...
- Problem 18-12 Various shareholders' equity topics; comprehensive [LO18-1, 18-4, 18-5, 18-6, 18-7, 18-8] Part A In...
- Hello There, This is discussion Question For Advanced Database Systems Question: (a) Please define what a...
- Physicians at a clinic gave what they thought were drugs to 860860 patients. Although the doctors...
- On January 1, 2018, bonds with a face value of $ 79,000 were sold. The bonds...
- How do I make this sort in true alphabetical order instead of ascii(ABCabc) order? I am...
- As a healthcare provider in physical therapy, athletic training, or as an exercise scientist and personal...