Question
In: Math
Learning Objective: The final statistics project will provide you with the opportunity to demonstrate your understanding...
Learning Objective: The final statistics project will provide you with the opportunity to demonstrate your understanding of the applied aspect of this course. In fulfilling this objective, you will fulfill the written statistical component requirement of the BBA program. You will decide on two valuable options. Option 1 will focus on making your own mini statistical study.
OPTION 1 First, brainstorm a problem (e.g., health, debt, student success, work, stress, happiness, customer satisfaction, etc.) that you're interested. It can be anything relevant to business, economics, management, etc.
Second, at least two different research questions and/or hypotheses. Note: The null and the alternative hypotheses count as ONE hypothesis. You need TWO different hypotheses/research questions. Sample question: Do students that drink energy drinks have higher GPAs? (Correlation)
Sample question: Do women experience more conflict at work than do men? (Independent Sample T-Test)
Sample question: Are there differences in degree choice satisfaction among freshman, sophomore, juniors, and seniors? (ANOVA)
Sample research hypothesis: H1: Men and women differ in their workplace stress levels. (Independent Sample T-Test)
Sample research hypothesis: H1: Drinking coffee impacts students' scores on exams. (Simple Linear Regression)
Sample research hypothesis: H1: Watching the news too often is correlated with being pessimistic about the world. (Correlations)
Third, develop at least a 5-10 question survey relevant to the research question or research hypothesis of your choice.
Sample survey questions. i. What's your sex? Male (1) ____ Female (2) ___ ii.
What is your age? ____ iii.
Have you ever experienced workplace conflict? Yes (1)___ No (0) ____ iv.
On a scale of 1-7, how stressed are you at work? Not stressed out 1 2 3 4 5 6 7 Very stressed out v.
How many times do you watch the news per week? ____ vi.
Do you experience stress due to conflict? Yes (1) ___ No (0) ___
vii. What is your perception of the current political leaders in the U.S.?
Fourth, collect the data from at least 10+ different people. (online or face-to-face) a a free online survey software system like Qualtrics or SurveyMonkey. Share the public hyperlink to at least 10 people (your target audience) through texts, social networking sites, emails, etc.... Then, download the responses as an Excel spreadsheet.
Fifth, select an analytical approach as a key word (e.g., percentages, frequencies, means, standard deviations, t-tests, ANOVA, linear regression, regression analysis, correlational analysis, multiple regression, etc...). Select the approaches according to your personal research question/hypothesis interests.
Sixth, design two visual graphical displays of the data (e.g., pie chart, bar graph, histogram, etc.) and/or analyze the data (e.g., correlation, t-test, ANOVA, regression) to share.
Seventh, interpret the results of your mini study. What's the answer to your questions and/or hypotheses? Share the visual results in your statistical report.
Eighth, find two credible references that support your study to enhance the professionalism and the credibility of your study. Make sure to cite them in your managerial report.
Ninth, complete the managerial report worksheet to help you draft your final managerial report.
Discuss the Data that was Selected and Where you got it from:
What data were selected? Why is this data interesting to you? Why is this issue important?
What data set was selected and why? What was the target audience who responded to the data set?
Overview the report
Hypotheses or Research Questions:
What were at least two hypotheses or research questions posed by the researcher(s)?
Methods:
What was the sample size? Any descriptive information?
What was the methodology employed in this study (e.g., surveys, interviews)? Was it adequate?
Analysis:
What data analysis strategies were adopted (e.g., descriptive (percentages, frequencies, means), t-test, ANOVA, linear regression, correlation, multiple regression)
Results:
Where each of the hypothesis (or research questions) supported or not supported given the selected data set?
Explain the findings using your own words.
*You must integrate at least two graphs/tables in your managerial report*
Conclusion:
Summarize your results
Conclude the report with a quote, or with a startling comment.
Solutions
Expert Solution
In March 2016, Hyperloop One, a Los Angeles based company proposed five routes in India for construction of Hyperloop. Bengaluru-Chennai corridor has been picked up as one such route. The proposed 334-km route is expected to be covered in 20 minutes as opposed to approximately six hours taken by the most preferred modes of transport i.e. rail and roads. While feasibility studies are underway, it will be apt to determine the share of Hyperloop, if implemented as per the proposal, in the total passenger transportation system.
Research Questions:
- What are different modes of transportation available between Bengaluru and Chennai? What is the share of each mode?
- What are the factors that determine the usage of any mode of transportation between Chennai and Bangalore?
- Compare different transportation modes available on the factors listed in Research Question 2.
- How does Hyperloop fare among the commuters with respect to different factors enlisted in Point 2?
- Determine the distribution plotting the number of commuters at each price-range charged for Hyperloop.
Research Roadmap:
- Defining the business research problem.
- The exploratory research would basically comprise of reviewing available literature and other secondary data in order to gain insights into availability of modes of transportation for the proposed route and the factors that affect the selection of a particular mode of transportation.
- Based on the results of exploratory research, survey will be the major descriptive research to be conducted.
- The sample will be stratified on the mode of transport used by them.
- The data type pertaining to the share of each transportation mode is ratio. It will be obtained via secondary sources.
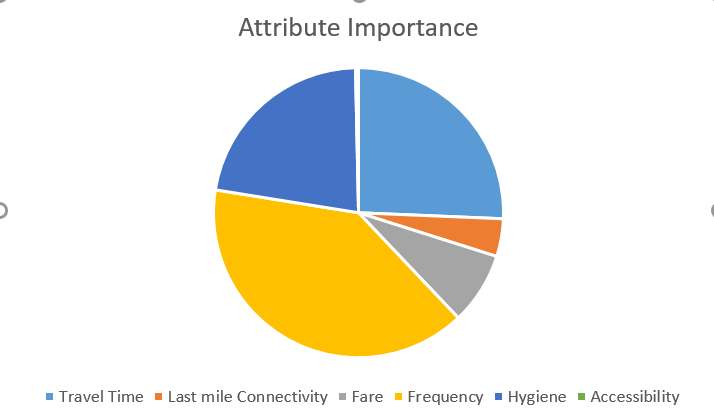
- The determining factors for selection of a particular mode of transport can be classified as categorical data. Research publications and other secondary data can be used for Research Question 2. Conjoint Analysis will be performed to find out the weightage to each factor.
- Analytic Hierarchy Process will be used for comparison of various modes on the attributes.
- The distribution for research question 5 would be plotted based on survey response.
Key variables and proposed methodologies for descriptive and/or causal research
Input Variables:
Attributes like price, safety, speed, last mile connectivity, frequency.
Output Variable:
Share of Hyperloop
|
METHODOLOGY |
REASONS FOR USING THE PARTICULAR METHODOLOGY |
|
Exploratory Research (Secondary Data) |
To gain insights into the prevalent mode of transportations and the factors determining the usage of a particular mode. |
|
Descriptive Research (Survey) |
In order to gather data regarding the preference of the commuters. |
|
Conjoint Analysis |
The weights assigned to various factors that determine the usage of a specific transportation mode. |
|
Analytic Hierarchy Procedure |
To take a decision regarding the choice of mode of transportation after evaluating the various criteria |
|
Stratified Sampling |
To reduce systematic bias in sampling when respondents are asked
to rate different modes on different attributes. |
 milcah answered 1 month ago
Related Solutions
Section C: Performance Activity Objective: To provide you with an opportunity to demonstrate the required performance...
This discussion board will give you the opportunity to demonstrate your understanding of one function of...
Use this assessment as an opportunity to demonstrate the breadth of your knowledge and understanding of...
In your final project you will be presenting your understanding of certain components of a Management...
Its purpose is to provide you an opportunity to demonstrate your ability to think like an...
Its purpose is to provide you an opportunity to demonstrate your ability to think like an...
In order to address the course learning objective. "...demonstrate your ability to develop an 'internal situation...
In order to address the course learning objective. "...demonstrate your ability to justify if current Corporate...
For the second phase of your final project, you will provide the functionality to your command...
Objective: To provide you with an opportunity to analyse data and information on the effectiveness of...
- Constructa 99% confidence interval for the population mean, µ, AND State what type of Interval you...
- Bob Loblaw and Wayne Jarvis get together to form a new corporation. They each own 50%...
- 1- Create a class called Point that has two instance variables, defined as private, as follows:...
- A football kicker can give the ball an initial speed of 24 m/s. He is 45...
- Austin Corporation started its production operations on January 1. During January, the Mixing Department completed 20,000...
- A company maintains two offices in a certain region, each staffed by two employees. Information concerning...
- The function x = (8.5 m) cos[(5?rad/s)t + ?/3 rad] gives the simple harmonic motion of...