Question
In: Economics
Illustrate the following event with an AS or AD shift: a. Government cuts defense spending. Instructions:...
Illustrate the following event with an AS or AD shift:
a. Government cuts defense spending.
Instructions: Grab either the
AD or AS curve and drag-and-drop it in a new position to represent
the resulting shift in AD or AS.
b. Interest rates rise.
Instructions: Grab either the AD or AS curve
and drag-and-drop it in a new position to represent the resulting
shift in AD or AS.
c. Imported oil gets cheaper.
Instructions: Grab either the AD or AS curve
and drag-and-drop it in a new position to represent the resulting
shift in AD or AS.
d. Taxes on the rich are increased.
Instructions: Grab either the AD or AS curve
and drag-and-drop it in a new position to represent the resulting
shift in AD or AS.
e. Consumer confidence increases.
Instructions: Grab either the AD or AS curve and drag-and-drop it in a new position to represent the resulting shift in AD or AS.
f. Taxes on consumers are cut.
Instructions: Grab either the AD or AS curve and drag-and-drop it in a new position to represent the resulting shift in AD or AS.
g. Oil becomes much more expensive.
Instructions: Grab either the AD or AS curve and drag-and-drop it in a new position to represent the resulting shift in AD or AS.
h. Interest rates fall.
Instructions: Grab either the AD or AS curve and drag-and-drop it in a new position to represent the resulting shift in AD or AS.
Solutions
Expert Solution
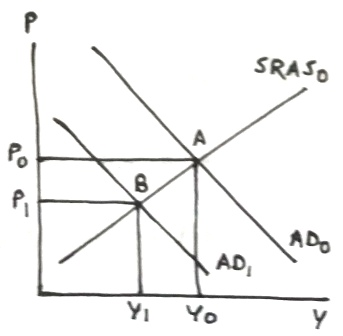
In each of the following graphs, initial equilibrium is at point A where AD0 (initial aggregate demand) and SRAS0 (initial short-run aggregate supply) curves intersect, with initial price level P0 and real GDP Y0.
(a)
Lower defense spending lowers government expenditure, which decreases aggregate demand, which will shift the AD curve to left, which decreases both price level (decreasing inflation) and real GDP in short run.
In following graph, decrease in aggregate demand shifts AD0 to left to AD1, intersecting SRAS0 at point B with lower price level P1 and lower real GDP Y1.
(b)
Higher interest rate lowers investment spending, which decreases aggregate demand, which will shift the AD curve to left, which decreases both price level (decreasing inflation) and real GDP in short run.
In following graph, decrease in aggregate demand shifts AD0 to left to AD1, intersecting SRAS0 at point B with lower price level P1 and lower real GDP Y1.

(c)
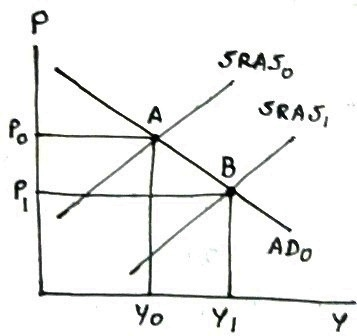
Cheaper oil price will lower production cost, which will increase aggregate supply, shifting SRAS curve rightward, decreasing price level and increasing real GDP in short run.
In following graph, SRAS0 shifts rightward to SRAS1, intersecting AD0 at point B with lower price level P1 and higher real GDP Y1.
(d)
Higher tax lowers disposable income and consumption spending, which decreases aggregate demand, which will shift the AD curve to left, which decreases both price level (decreasing inflation) and real GDP in short run.
In following graph, decrease in aggregate demand shifts AD0 to left to AD1, intersecting SRAS0 at point B with lower price level P1 and lower real GDP Y1.

(e)
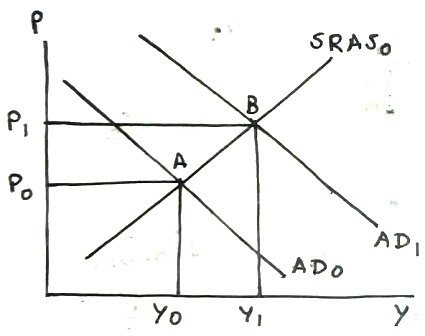
Higher consumer confidence increases consumption, which increases aggregate demand, which will shift the AD curve to right, which increases both price level (increasing inflation) and real GDP in short run.
In following graph, increase in aggregate demand shifts AD0 to right to AD1, intersecting SRAS0 at point B with higher price level P1 and higher real GDP Y1.

(f)
A tax cut increases disposable income and consumption, which increases aggregate demand, which will shift the AD curve to right, which increases both price level (increasing inflation) and real GDP in short run.
In following graph, increase in aggregate demand shifts AD0 to right to AD1, intersecting SRAS0 at point B with higher price level P1 and higher real GDP Y1.

(g)
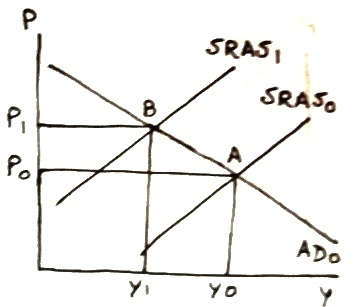
Higher oil price increases production cost, which will reduce aggregate supply, shifting SRAS curve leftward, increasing price level and decreasing real GDP, causing stagflation in short run.
In following graph, SRAS0 shifts leftward to SRAS1, intersecting AD0 at point B with higher price level P1 and lower real GDP Y1.
(h)
Lower interest rate raises investment, which increases aggregate demand, which will shift the AD curve to right, which increases both price level (increasing inflation) and real GDP in short run.
In following graph, increase in aggregate demand shifts AD0 to right to AD1, intersecting SRAS0 at point B with higher price level P1 and higher real GDP Y1.
 Rahul Sunny answered 3 years ago
Related Solutions
Graph #3 Economic Impact: The U.S. Government cuts defense spending. Question 37 (1 point) Saved What...
Use an AD-AS model to depict the following scenarios in the short-run: The government cuts taxes...
6. When a government engages in an expansionary fiscal policy, it cuts government spending and raises...
1. Using AD and AS model, graphically explain the following: Suppose that the Government increases spending...
If we increase government spending on education and infrastructure how will this impact AD/AS in the...
From a position of potential GDP and zero inflation, the government increases defense spending (an increase...
illustrate the effects of an increase in government spending using the classical model assuming that money...
Suppose growth in government spending in an economy permanently rises. Using the AD-AS model, explain the...
problems 20-9 the federal government increases spending on national defense on the golliwing graph indicate the...
Government borrowing makes the most sense for which type of spending: defense, education, or social security....
- code a Java program that: Requests from the user for a text filename to read the...
- Discuss how the ARIES algorithm must operate under the circumstances that the system crashes during recovery
- (a) Based on the information in the above table, what is the unemployment rate? What is...
- Question 3 (a) What do you understand by a time series forecasting approach? Describe each of...
- 1 Which of the following overflow values clips all content that extends beyond the containing element’s...
- What are the key environmental and biological controls over decomposition rate in ecosystems?
- describe why independent oversight is important to taxpayers.