Question
In: Math
Suppose an experiment is conducted where 100 students at BU are measured and their average height...
Suppose an experiment is conducted where 100 students at BU are measured and their average height is found to be 67.45 inches, and the (sample) standard deviation to be 2.93 inches. Since 100 is a large sample, we use the sample standard deviation as an estimate of the population standard deviation. We may assume that heights are normally distributed.
(a) Suppose that you want to report the 95.45...% confidence interval (i.e., exactly 2 standard deviations). Give the results of this experiment.
(b) Repeat (a) but for the 99.73... % (exactly 3 standard deviations) confidence interval.
(c) Now suppose you want to report the precisely 95.0% confidence interval (which will be slightly less than 2 standard deviations -- find out the exact figure) Repeat (a) using this confidence interval.
(d) Repeat (c) but for the precisely 99.0% confidence interval.
Solutions
Expert Solution
a) Mean ( )
= 67.45
)
= 67.45
Sample size (n) = 100
Standard deviation (s) = 2.93
Confidence interval(in %) = 95.45
z @ 95.45% = 2.001
Since we know that
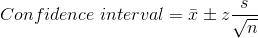
Required confidence interval = 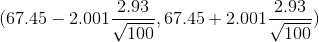
Required confidence interval = (67.45-0.5863, 67.45+0.5863)
Required confidence interval = (66.8637, 68.0363)
b) Confidence interval(in %) = 99.73
z @ 99.73% = 2.995
Required confidence interval = 
Required confidence interval = (67.45-0.8775, 67.45+0.8775)
Required confidence interval = (66.5725, 68.3275)
c) Confidence interval(in %) = 95
z @ 95.0% = 1.96
Required confidence interval = 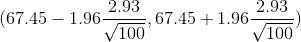
Required confidence interval = (67.45-0.5743, 67.45+0.5743)
Required confidence interval = (66.8757, 68.0243)
d) Confidence interval(in %) = 99
z @ 99.0% = 2.576\
Required confidence interval = 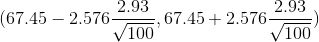
Required confidence interval = (67.45-0.7548, 67.45+0.7548)
Required confidence interval = (66.6952, 68.2048)
Please hit thumps up if the answer helped you.
 milcah answered 3 months ago
Related Solutions
Suppose you collect data on people’s height from a sample of 100 people. The average height...
You would like to study the height of students at your university. Suppose the average for...
You would like to study the height of students at your university. Suppose the average for...
T-Test A research team measured 70 American men’s height. The average height of these men is...
The average height for a student in a class with n = 60 students is a...
The state of California conducted an experiment with college students. Teachers and students were randomly assigned...
In a statistics class, last spring, the students measured their height, their arm span (finger tip...
A study is conducted to look at the time students exercise in average. In a random...
4.11 Consider the hardness testing experiment described in Section 4.1. Suppose that the experiment was conducted...
Your task is to calculate the average height of students in the class. You will gather...
- Question 3 (a) What do you understand by a time series forecasting approach? Describe each of...
- 1 Which of the following overflow values clips all content that extends beyond the containing element’s...
- What are the key environmental and biological controls over decomposition rate in ecosystems?
- describe why independent oversight is important to taxpayers.
- Graph a Monopoly. Compare the price, quantity, and ATC of a monopoly with a perfectly competitive...
- Problem 18-12 Various shareholders' equity topics; comprehensive [LO18-1, 18-4, 18-5, 18-6, 18-7, 18-8] Part A In...
- Hello There, This is discussion Question For Advanced Database Systems Question: (a) Please define what a...