Question
In: Math
random sample of 33 33 professional baseball salaries from 1985 through 2015 was selected. The league...
random sample of 33 33 professional baseball salaries from 1985 through 2015 was selected. The league of the player (American or National) was also recorded. Salary (in thousands of dollars) and league are shown in the accompanying table. Test the hypothesis that there is a difference in the mean salary of players in each league. Assume the distributions are Normal enough to use the t-test. Use a significance level of 0.05 0.05.
Solutions
Expert Solution
there is no data in question
Let
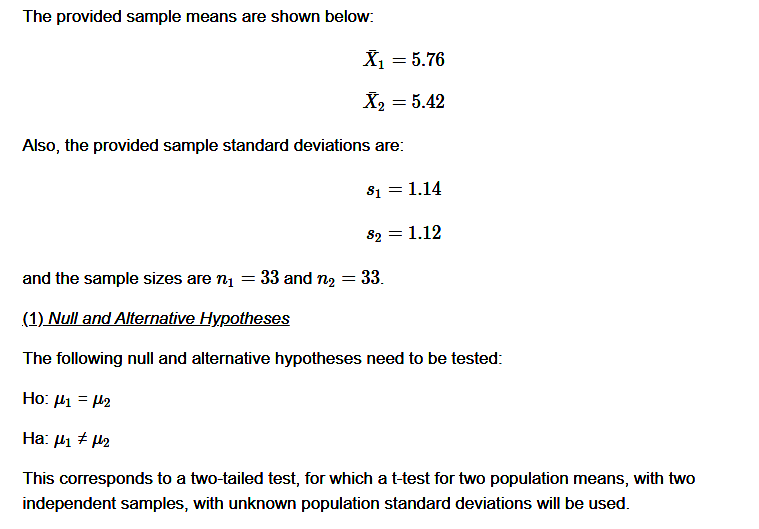
X1 bar = 5.76 and X2 bar = 5.42
S1 = 1.14 and S2 = 1.12
n1 = 33 and n2 = 33
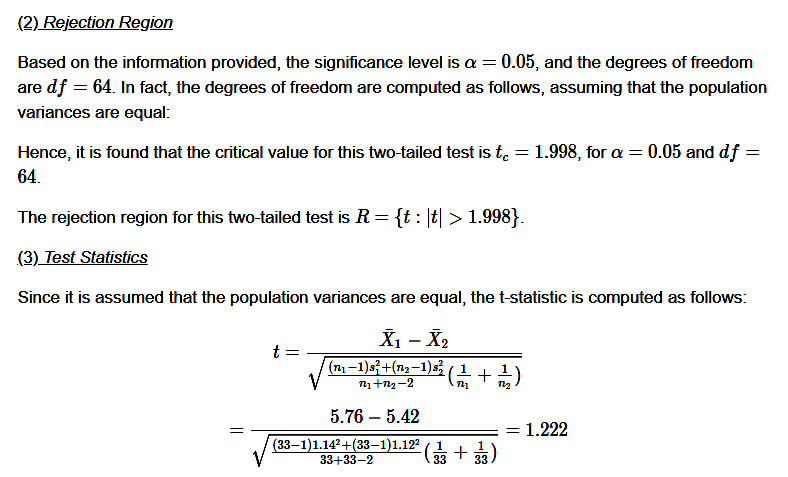
Test the hypothesis that there is a difference in the mean salary of players in each league
Follow the procedure if you have different values or Data
If data are given
Excel:
Mean = AVERAGE(A2:A34)
SD = STDEV(A2:A34)
same as for the second sample also (replace A with B)
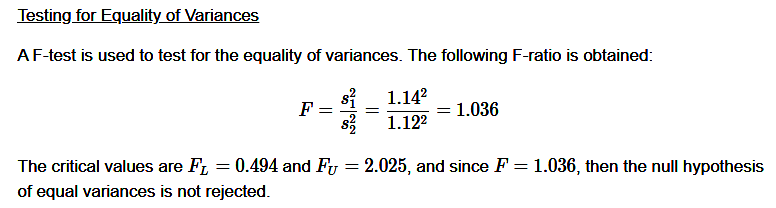
In case equal variance is rejected
But Here in this example, an equal variance is not rejected So,
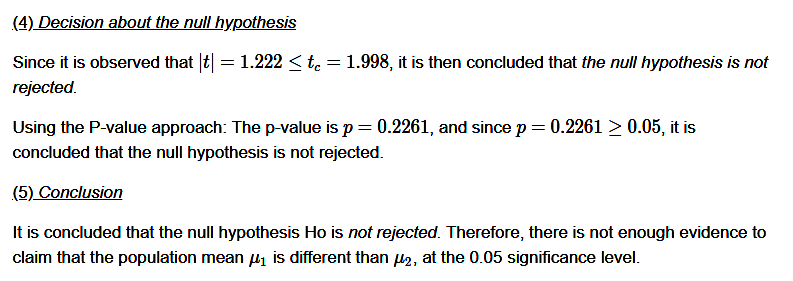
there is no difference in the mean salary of players in each league
(If P-value < 0.05, H0 is rejected and there is a difference in the mean salary of players in each league)
 milcah answered 3 months ago
Related Solutions
HR Slugger is a professional baseball player in a Major League Baseball league. He is a...
Consider the salaries of Major League Baseball players from 1988 to 2011 (you can find that...
A sample of 16 Triple-A minor league baseball teams were selected for statistical analysis. The following...
A sample of 16 Triple-A minor league baseball teams were selected for statistical analysis. The following...
A sample of 16 Triple-A minor league baseball teams were selected for statistical analysis. The following...
The following data represent baseball batting averages for a random sample of National League players near...
sample of 16 Triple-A minor league baseball teams were selected for statistical analysis. The following data...
The baseball players salaries from the 2015 season have apopulation mean μ = 4.215 million...
The baseball players salaries from the 2015 season have a population mean μ = 4.215 million...
A sample of 33 observations is selected from a normal population. The sample mean is 53,...
- Problem 18-12 Various shareholders' equity topics; comprehensive [LO18-1, 18-4, 18-5, 18-6, 18-7, 18-8] Part A In...
- Hello There, This is discussion Question For Advanced Database Systems Question: (a) Please define what a...
- Physicians at a clinic gave what they thought were drugs to 860860 patients. Although the doctors...
- On January 1, 2018, bonds with a face value of $ 79,000 were sold. The bonds...
- How do I make this sort in true alphabetical order instead of ascii(ABCabc) order? I am...
- As a healthcare provider in physical therapy, athletic training, or as an exercise scientist and personal...
- in the market for makeup artists, what happens after the invention of high-definition tv allowing viewers...