Question
In: Statistics and Probability
The table below lists measured amounts (mg) of tar, carbon monoxide (CO), and nicotine in king...
The table below lists measured amounts (mg) of tar, carbon monoxide (CO), and nicotine in king size cigarettes of different brands. Tar 25 27 20 24 20 20 21 24 CO 18 16 16 16 16 16 14 17 Nicotine 1.5 1.7 1.1 1.6 1.1 1.0 1.2 1.4 Use the amounts of nicotine and carbon monoxide (CO).
1.Find the value of the linear correlation coefficient between amounts of nicotine and carbon monoxide.
2.Use the data and determine whether there is sufficient evidence to support a claim of a linear correlation between amounts of nicotine and carbon monoxide. Find the P-value.
3.Based on the P-value, is there a linear correlation between the amounts of nicotine and carbon monoxide?
4.Using the data, and letting y represent the amount of carbon monoxide and letting x represent the amount of nicotine, find the regression equation.
5.Referring to the data in Question 16, The Raleigh brand king size cigarette is not included in the table, and it has 1.3 mg of nicotine. What is the best predicted amount of carbon monoxide?
Solutions
Expert Solution
- Excel output for correalation and regression equation
-
No x=Nicotine y=co (x-xbar)^2 (y-ybar)^2 (x-xbar)*(y-ybar) 1 1.5 18 0.030625 3.515625 0.328125 2 1.7 16 0.140625 0.015625 -0.046875 3 1.1 16 0.050625 0.015625 0.028125 4 1.6 16 0.075625 0.015625 -0.034375 5 1.1 16 0.050625 0.015625 0.028125 6 1 16 0.105625 0.015625 0.040625 7 1.2 14 0.015625 4.515625 0.265625 8 1.4 17 0.005625 0.765625 0.065625 sum 10.6 129 0.475 8.875 0.675 mean 1.325 16.125 sxx syy sxy - Below calculated slope,intercept and correalation coiefficient
| slope=b1=sxy/sxx | 1.421052632 | |
| intercept=b0=ybar-(slope*xbar) | 14.24210526 | |
| SST | SYY | 8.875 |
| SSR | sxy^2/sxx | 0.9592105 |
| SSE | syy-sxy^2/sxx | 7.9157895 |
| r^2 | SSR/SST | 0.1080801 |
| r | sxy/sqrt(sxx*syy) | 0.3287553 |
==========================================
- 1)

r=sxy/sqrt(sxx*syy) =0.3287
applying the above values in the formula of r gives r=0.328. i have atached the calculations below.
============================================================
2.Use the data and determine whether there is sufficient evidence to support a claim of a linear correlation between amounts of nicotine and carbon monoxide. Find the P-value.
-
Step 1:
H0: Null Hypothesis:
 =0
=0HA: Alternative Hypothesis:
 0
0Step 2:
r = 0.328
n = 8
 =0.01
=0.01df = 8 - 2 = 6
Test Statistic is given by:
-
t=r*sqrt((n-2)/(1-r^2))
t=0.328*sqrt(6/(1-0.328*0.328))
t=0.8505
Step 3:
Corresponding to t score = 0.8505, df = and Two Tail Test, By Technology,
p - value = 0.6152
 =0
=0 0
0============================================================
3.)
Based on the P-value, is there a linear correlation between the amounts of nicotine and carbon monoxide?
Step 4:
Since p - value = 0.6152 is greater than  = 0.01, the difference is not significant. Fail to reject null
hypothesis.
= 0.01, the difference is not significant. Fail to reject null
hypothesis.
A,the correlation coefficient is 0.328 which indicate a weak correlation. That is there is no sufficient evidence to support the claim that there is a linear correlation between amounts of noictotine and carbon monoxide.
============================================================================
4.Using the data, and letting y represent the amount of carbon monoxide and letting x represent the amount of nicotine, find the regression equation.
| slope=b1=sxy/sxx | 1.421052632 | |
| intercept=b0=ybar-(slope*xbar) | 14.24210526 |
- B,The required regression equation is
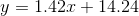
the linear regression line of y on x takes the form


================================================================
5.Referring to the data in Question 16, The Raleigh brand king size cigarette is not included in the table, and it has 1.3 mg of nicotine. What is the best predicted amount of carbon monoxide?
c,considering x as 1.3 in the regression equation obtained in B, the predicted value is 16.086. the predicted value is much higher than the actual value 15.

best predicted amount of carbon monoxide =16.086
================================================================
 orchestra answered 3 years ago
Related Solutions
The accompanying table provides data for tar, nicotine, and carbon monoxide (CO) contents in a certain...
The accompanying table provides data for tar, nicotine, and carbon monoxide (CO) contents in a certain...
The accompanying table provides data for tar, nicotine, and carbon monoxide (CO) contents in a certain...
The accompanying table, MultiLinear Regression 5, provides data for tar, nicotine, and carbon monoxide (CO) contents...
Are cigarettes bad for people? Cigarette smoking involves tar, carbon monoxide, and nicotine (measured in milligrams)....
1. Tar in cigarettes: Listed below are amounts of tar (mg per cigarette) in sing size...
3. Tar in cigarettes: Listed below are amounts of tar (mg per cigarette) in sing size...
The table below lists measured amounts of redshift and the distances (billions of light-years) to randomly...
The table below lists measured amounts of redshift and the distances (billions of light-years) to randomly...
The table below lists measured amounts of redshift and the distances (billions of light-years) to randomly...
- Problem 18-12 Various shareholders' equity topics; comprehensive [LO18-1, 18-4, 18-5, 18-6, 18-7, 18-8] Part A In...
- Hello There, This is discussion Question For Advanced Database Systems Question: (a) Please define what a...
- Physicians at a clinic gave what they thought were drugs to 860860 patients. Although the doctors...
- On January 1, 2018, bonds with a face value of $ 79,000 were sold. The bonds...
- How do I make this sort in true alphabetical order instead of ascii(ABCabc) order? I am...
- As a healthcare provider in physical therapy, athletic training, or as an exercise scientist and personal...
- in the market for makeup artists, what happens after the invention of high-definition tv allowing viewers...