Question
In: Math
Logging in western North America impacts populations of western trillium, a long-lived perennial that inhabits confider...
Logging in western North America impacts populations of western trillium, a long-lived perennial that inhabits confider forests (Trillium ovatum). Jules and Ratchke (1999) measured attributes of eight local populations of western trillium, confined to forest patches of varying size created by logging in southwestern Oregon. Their data, presented in the following table, compares estimates of recruitment (the density of new plants produced in each population per year) at each site with the distance from the site to the edge of the forest fragment.
|
Local population |
Distance to clear-cut edge (m) |
Recruitment |
|
1 |
67 |
0.0053 |
|
2 |
65 |
0.0021 |
|
3 |
61 |
0.0069 |
|
4 |
30 |
0.0006 |
|
5 |
84 |
0.0124 |
|
6 |
97 |
0.0045 |
|
7 |
16 |
0.0028 |
|
8 |
332 |
0.0182 |
a. Display these data in an appropriate graph. Examine the graph and describe the shape of the distribution. What departures from the assumption of correlation analysis do you detect?
b. Choose a transformation and transform one or both of the two variables. Plot the results. Did the transformation solve the problem? If not, try a different transformation.
c. Using the transformed data, estimate the correlation coefficient between the two variables. Provide a standard error with your estimate.
d. Calculate an approximate 95% confidence interval for the correlation coefficient.
Solutions
Expert Solution
a) Here the variable (distance to clear-cut edge) is the predictor and the variable Recruitment is the response. The best diagram to represent this given data is a scatterplot which has been drawn using minitab.
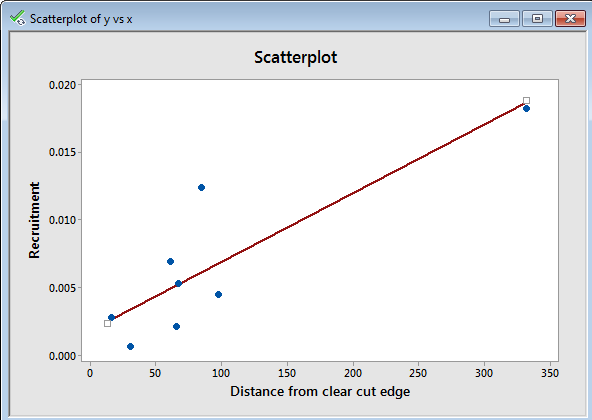
As we can see from the scatterplot there is a leverage value in the given dataset.
From the minitab software we can see that observation 8 has an unusual x(predictor) value.
Further observation 5 has a large residual value .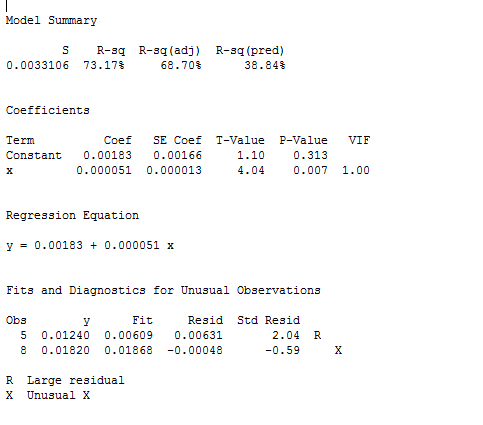
b)The easiest solution is to get rid of the unusual observations and carry out regression analysis without those two observations. However one can also use robust regression or transformation of variables to get rid of the problem.
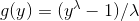
Here i am using box cox transformation
Using minitab software we are using an optimum choice of
 = 0.5. The results are shown below.
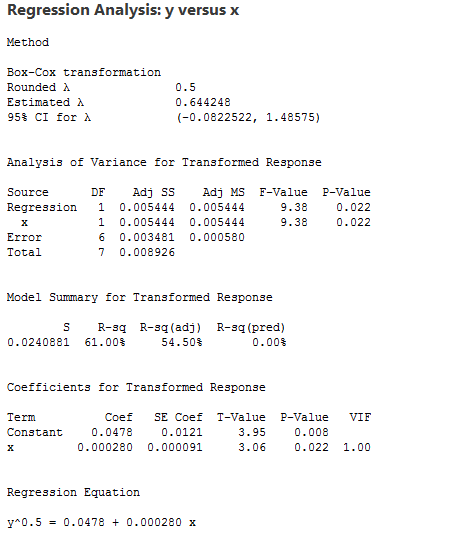
Scatterplot of transformed variable is given below.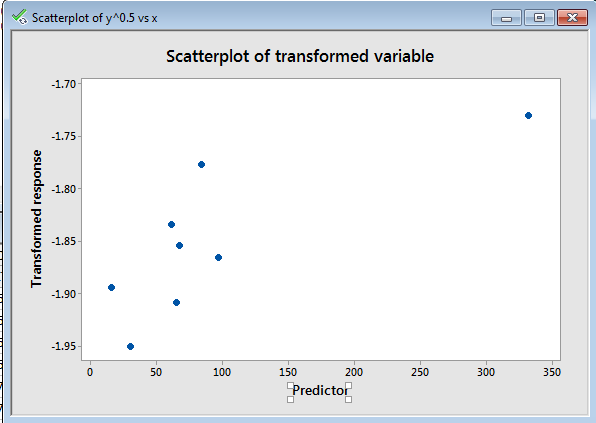
However the leverage point still creates problem in the dataset.
c)The corrrelation coefficient between the transformed response and the predictor is given by 0.781 (calculated using minitab)
 milcah answered 4 months ago
Related Solutions
If the states in North America, Western Europe, and East Asia all were to meet the...
Lacrosse is one of the oldest sports in North America. Despite its long history, it is...
. Differentiate the terminology White, Caucasian, Occidental and Western populations.
QUESTION 1 The first commercial bank in America was the Bank of North America, chartered by...
How has the African diaspora been critical to the economic development of North America, South America,...
Discuss the benefits to BMW North America of owning BMW Bank.
The largest cat in North America is the Jaguar. They can sometimes be seen in the...
compare and contrast the overall geography of North and South (Latin) America?
Discuss how long-lived assets are reported and analyzed.
Bikes LLC is a company that manufactures and sells motorcycles in North America. It has the...
- On January 1, 2018, bonds with a face value of $ 79,000 were sold. The bonds...
- How do I make this sort in true alphabetical order instead of ascii(ABCabc) order? I am...
- As a healthcare provider in physical therapy, athletic training, or as an exercise scientist and personal...
- in the market for makeup artists, what happens after the invention of high-definition tv allowing viewers...
- 10. What are the three monetary policy tools of the Fed? Briefly describe how each tool...
- In what ways would the role of a manager working in a nonstandard international assignment arrangement...
- Write a Bash script called move that could replace the UNIX command mv. 'move' tries to...