Question
In: Computer Science
Write a function that plots a spline curve for arbitrary x values if a solution for...
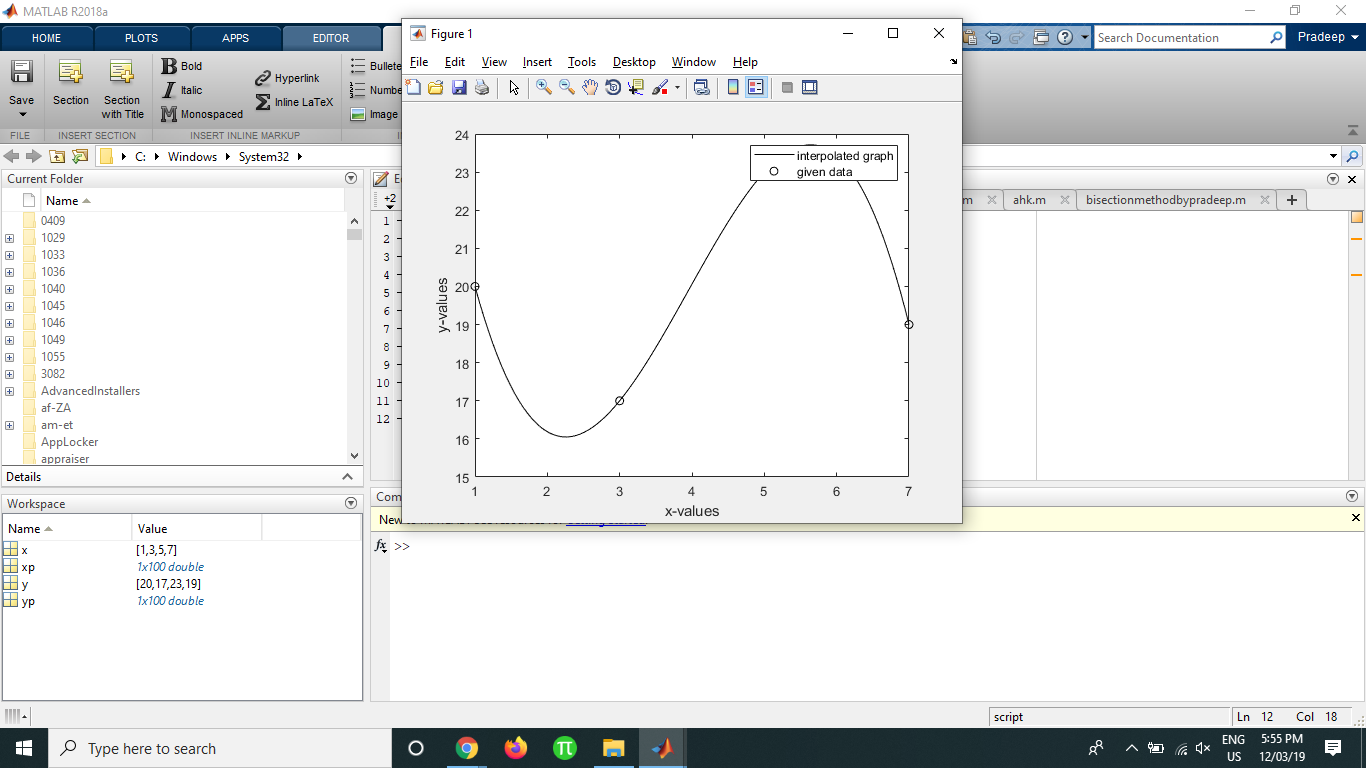
Write a function that plots a spline curve for arbitrary x values if a solution for Ci is provided in vector form. Name the function spline_group and illustrate results.
Matlab Program
Solutions
Expert Solution
`Hey,
Note: Brother if you have any queries related the answer please do comment. I would be very happy to resolve all your queries.
clc
clear all
close all
clear all
x=[1 3 5 7];
y=[20 17 23 19];
xp=linspace(1,7,100);
yp=interp1(x,y,xp,'spline');
plot(xp,yp,'k',x,y,'ko')
xlabel('x-values'),ylabel('y-values'),
legend('interpolated graph','given data')
axis([1 7 15 24])
Kindly revert for any queries
Thanks.
 venereology answered 4 months ago
Related Solutions
x = [0,1,2,3,4,5,6,7,8]; y = [0,10,23,28,25,13,6,2,-5]; Spline interpolation, Use Matlab code Write your own spline method...
x = [0,1,2,3,4,5,6,7,8];
y = [0,10,23,28,25,13,6,2,-5];
Spline interpolation, Use Matlab code
Write your own spline method to estimate the value of the function
on x ∈ [0,8],Δx = 0.1. For your 2 degrees of freedom, set the first
and second
derivatives at the left boundary to 0. Save your result, the
interpolated y values.(do not use Matlab's built-in spline
method
S(x) is a cubic spline for the function f(x) = sin(pi x/2) + cos(pi x/2) at...
S(x) is a cubic spline for the function f(x) = sin(pi x/2) +
cos(pi x/2) at the nodes x0 = 0 ,
x1 = 1 , x2 = 2
and satisfies the clamped boundary conditions. Determine the
coefficient of x3 in S(x) on [0,1] ans. pi/2 -3/2
y'=y-x^2 ; y(1)= -4 Write a MATLAB program that makes two plots of the solution to...
y'=y-x^2 ; y(1)= -4
Write a MATLAB program that makes two plots of the solution to
the equation using the following values. Suggest you use nested
loops instead of two different loops. Be sure to label your
plots.
a. x0 = 1.0, step size h = .2, number of steps n = 20.
b. x0 = 1.0, step size h = .05, number of steps n = 80.
Write a MATLAB function, called arbpoly, that computes a polynomial arbitrary nth degree. The function will...
Write a MATLAB function, called arbpoly, that computes a
polynomial arbitrary nth degree. The function will take 2
inputs:
1) the first input will be a row vector, c, containing the
coefficients of the polynomial, starting with the coefficient of
the highest - degree term;
2) the second input will be a scalar, x, which is a real number
at which the polynomial will be evaluated.
The function's only output, y, will be the scalar value of the
polynomial computed...
Write a function that plots the following trajectory equations using python turtle graphics. x = v*sin(A)*t...
Write a function that plots the following trajectory equations
using python turtle graphics.
x = v*sin(A)*t
y = v*cos(A)*t -.5*(9.8)*t**2
Loop through t starting at 0 and increment by .1 until y<=0.
(hint, while loop) Experiment with values of velocity V (1 to 20)
and angle A (0 to 90) that gives you a good plot that does not go
off the screen. Position the start of the plot at the left bottom
of the screen
Write a function printTwoLargest() that inputs an arbitrary number of positive numbers from the user. The...
Write a function printTwoLargest() that inputs an arbitrary
number of positive numbers from the user. The input of numbers
stops when the first negative or zero value is entered by the user.
The function then prints the two largest values entered by the
user. If no positive numbers are entered a message to that effect
is printed instead of printing any numbers. If only one number is
inputted, only the largest is printed out (see 2nd
example below). Sample output:...
Write a python function that accepts two integer values corresponding to the point (x, y). Check...
Write a python function that accepts two integer values
corresponding to the point (x, y). Check whether the point is
within the rectangle centered at (0, 0) with width 20 and height
15. For example, (-9, 7) is inside the rectangle and (11, 4) is
outside the rectangle, as shown in the figure. Return True if the
point falls within the rectangle and False otherwise
A natural cubic spline S is defined by S(x) = { S0(x) = a0 + b0(x...
A natural cubic spline S is defined by S(x) = { S0(x) = a0 +
b0(x − 1) + d0(x − 1)3 , if 1 ≤ x ≤ 2, S1(x) = a1 + b1(x − 2) − 3 4
(x − 2)2 + d1(x − 2)3 , if 2 ≤ x ≤ 3. Use S to interpolate data
f(1) = 1, f(2) = 1, f(3) = 0, find a0, b0, d0, a1, b1, and d1.
Set up the triple integral of an arbitrary continuous function f(x, y, z) in spherical coordinates...
Set up the triple integral of an arbitrary continuous function
f(x, y, z) in spherical coordinates over the solid shown. (Assume a
= 4 and b = 8. ) f(x, y, z) dV E = 0 π/2 f , , dρ dθ dφ 4
In a hypothetical country, for an arbitrary good, the demand curve for that good is “Q=...
In a hypothetical country, for an arbitrary good, the demand
curve for that good is “Q= 200 - 4 P”. For the supply side, the
fixed cost is 100 and the average cost is "0.5Q +20 + 100/Q".
(a) If there is free trade, and the world price pw =
42. Under perfect competition, what is the consumer surplus and
producer surplus? (3 points)
(b) If there is free trade, and the world price pw =
42. Under monopoly, what...
ADVERTISEMENT
ADVERTISEMENT
Latest Questions
- Use the internet to read more about journaling file systems such as NTFS, extfs2, and extfs3....
- Consider the quick sort algorithm. The quick sort algorithm is a divide and conquer approach which...
- Tesla 1. How to make these weaknesses into strengths? Burn through cash, high prices, bottlenecking/product delays,...
- Assignment # 12: Email Presentation Learning Objectives and Outcomes Design a PowerPoint presentation appropriate for middle...
- Identify which of the perspectives you believe is the BEST for accurately explaining human behavior and...
- What trade policies should a country adopt? why? Explain. Also, find some reference materials on this...
- In Java: Suppose you want to implement a Sudoku game that consists of 9x9 rows and...
ADVERTISEMENT