Question
In: Economics
Q TC 0 $ 100 1 110 2 130 3 160 4 200 5 250 6...
|
Q |
TC |
|
0 |
$ 100 |
|
1 |
110 |
|
2 |
130 |
|
3 |
160 |
|
4 |
200 |
|
5 |
250 |
|
6 |
310 |
|
7 |
380 |
|
8 |
460 |
|
9 |
550 |
|
10 |
650 |
|
11 |
760 |
- Say the firm is in a perfectly competitive market. If the current market (equilibrium) price is $ 60, at what output level will the firm as a profit maximizer produce at?
- Say the market price rises to $ 80. At what output level (as a perfect competitor) will this produce at?
- How much profit is the firm making at a price of $80? Based on this calculation, do you expect firms to enter or leave this market?
- Say instead this firm is a monopoly. If the firm maximizes profit at an output level where marginal revenue equals $ 50, what output level will this be?
Solutions
Expert Solution
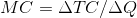
The perfectly competitive firm produces where the marginal cost
equals the marginal revenue and the market price is also equal to
the average and marginal revenue.  .
.
In this graph we have to find out the marginal cost at every output produced, the marginal cost is the addition made to the total cost when an additional unit is produced.
 .
.
| Q | TC | MC |
| 0 | 100 | - |
| 1 | 110 | 10 |
| 2 | 130 | 20 |
| 3 | 160 | 30 |
| 4 | 200 | 40 |
| 5 | 250 | 50 |
| 6 | 310 | 60 |
| 7 | 380 | 70 |
| 8 | 460 | 80 |
| 9 | 550 | 90 |
| 10 | 650 | 100 |
| 11 | 760 | 110 |
a). If the market price is $60 and that is also equal to the marginal revenue , the firm produces marginal cost equals the marginal revenue. The firm would produce 6 units.
b). If the price rises to $80 the firm would produce 8 units.
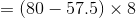
c). The profit is calculated by 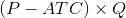 .
.
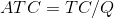
Here we divide the total cost by the quantity to get the average cost.
 .
.
 .
.
 .
.
Profit .
 .
.
 .
.
 .
.
Profit equals $180.
The firm is earning a positive profit and the price is well above the average cost , so the firm should produce in this context. Due to positive profits in the market new firms will enter the market.
d).The monopolist also maximizes the profit where the marginal revenue equals the marginal cost ,so if this is a monopoly the firm would produce 5 units.
 Rahul Sunny answered 4 months ago
Related Solutions
Q 0 1 2 3 4 5 6 7 8 TC 10 18 24 30 38...
Period Demand 1 110 2 115 3 125 4 127 5 130 6 134 a) Prepare...
exampleInput.txt 1 2 3 0 2 3 4 0 1 3 5 0 1 2 6...
Output TC MC ATC AFC TVC AVC TFC 0 1 2 3 4 5 6 7...
x (Bins) frequency 0 0 1 0 2 0 3 2 4 5 5 8 6...
6 5 4 5 0 0 13 48 6 1 0 7 2 0 1 1...
0 1 2 3 4 5 6 7 Project A -$300 -$387 -$193 -$100 $600 $600...
Q-1 # of workers Output (flags( 0 0 1 50 2 110...
Period Forecast 1 200 2 500 3 300 4 400 5 200 6 200 Regular time:...
Year Cash Flow 0 $0 1 $250 2 $400 3 $500 4 $600 5 $600 What...
- Students performed a procedure similar to Part III of this experiment (Analyzing a Vitamin Supplement for...
- The output of the function is a dictionary whose keys represent the bins and whose values...
- The shape of a graph of a binomial distribution depends on the value of both n...
- In 2012, cost per Medicare beneficiary did what?
- 3. A. What techniques can a firm use to optimize demand deposit holdings? B. How do...
- The half-life of mercury-197 is 64.1 hours. If a patient undergoing a kidney scan is given...
- Double bonds react with Br2 to form a dibromide. Isobutylene undergoes cationic polymerization under conditions where...