Question
In: Physics
Draw and explain the P-V graph for both adiabatic and isothermal processes and explain the difference.
Draw and explain the P-V graph for both adiabatic and isothermal processes and explain the difference.
Solutions
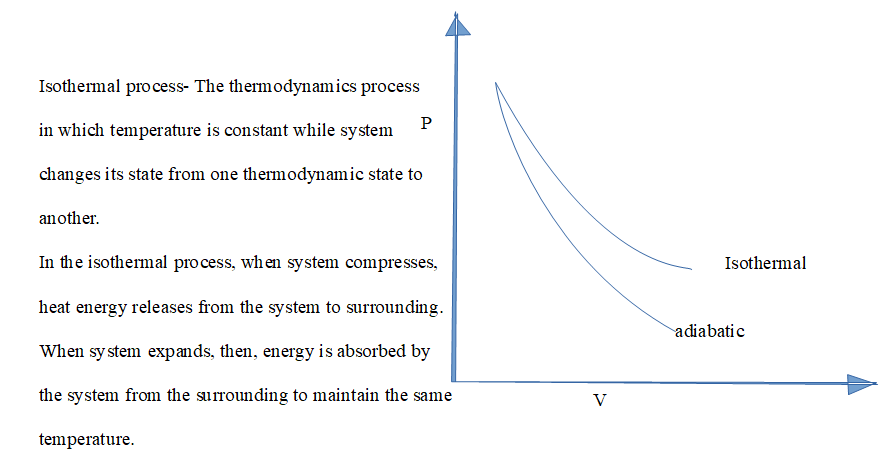
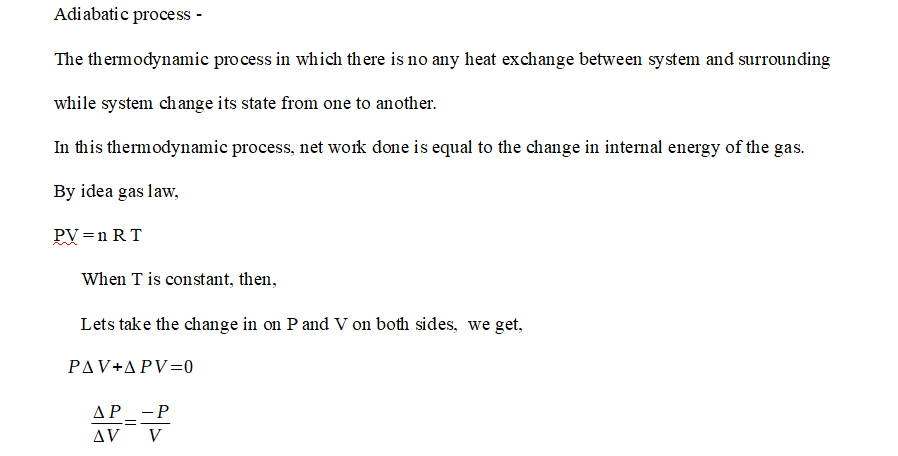
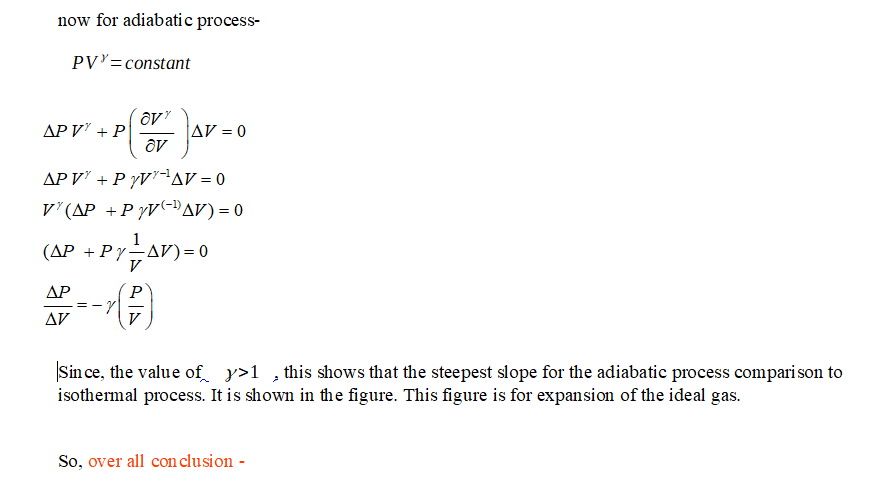
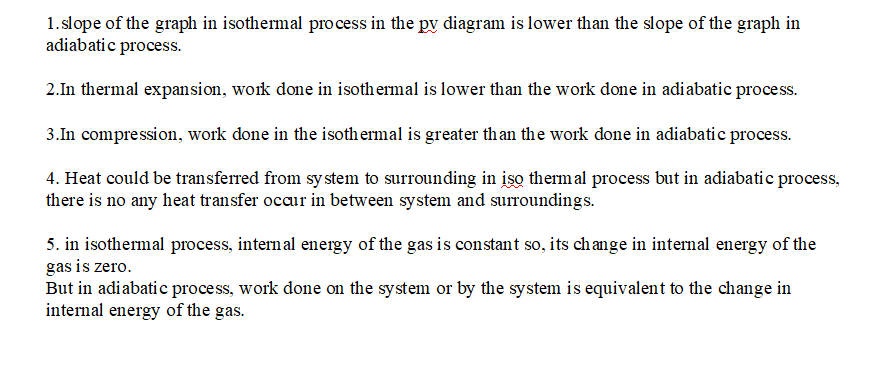
 genius_generous answered 6 months ago
Related Solutions
What is the difference between isothermal and adiabatic? 300 cm3 of an ideal diatomic gas at...
What is the difference between isothermal and adiabatic? 300 cm3
of an ideal diatomic gas at a pressure of 1 atmosphere and a
temperature of 300 K (i.e. room temperature) is contained by a
cylinder with a piston top. A camshaft turns and drives the piston
further into the cylinder, reducing the volume to 100 cm3 .
(a) What is the final pressure if this compression takes place
isothermally? What is the final pressure and temperature if the
compression takes...
The PV diagram of an adiabatic expansion, the graph of P= CV-γ, where C is a...
The PV diagram of an adiabatic expansion, the graph of
P= CV-γ, where C is
a constant and γ =
Cp/Cv.
GOAL Use the adiabatic pressure vs. volume
relation to find a change in pressure and the work done on a
gas.
PROBLEM A monatomic ideal gas at an initial
pressure of 1.01 105 Pa expands adiabatically
from an initial volume of 1.50 m3, doubling its volume.
(a) Find the new pressure. (b)
Sketch the PV diagram and estimate the work...
Derive the following statement "T(temperatue)-V(volume) and P(pressure)-V(volume) relationship in the adiabatic changes"
Derive the following statement
"T(temperatue)-V(volume) and P(pressure)-V(volume) relationship
in the adiabatic changes"
Neatly draw and label both the market and representative firm graph for a firm in a...
Neatly draw and label both the market and representative firm graph
for a firm in a perfect competition which is earning an economic
loss in the short run and should choose to operate at a loss. What
is going to happen in the long run? How will this affect the
graph?
Ideal gas is expanded keeping (a) P V 2=const, (b) P 2V =const. Do these processes...
Ideal gas is expanded keeping (a) P V 2=const, (b) P
2V =const. Do these processes lead to temperature
increase or to temperature decrease? Find the specific heat
capacities for the gas during these processes.
(a) Construct the P-V graph for the Carnot cycle operating between 700 and 200 oC if...
(a) Construct the P-V graph for the Carnot cycle operating
between 700 and 200 oC if isothermal expansion of water
vapor occurs between 1 and 8 L/mol. Determine the relevant
quantities of heat, work, energy and entropy. Compare the results
obtained using the IGL and the NIST database.
On the graph below, draw the demand curves for widgets, both before and after the government...
On the graph below, draw the demand curves for widgets, both
before and after the government announces that anyone buying a
widget will be subject to a new stiff tax.
On the graph below, draw the demand curves for apples, both
before and after a sharp increase in the price of apples.
On the graph below, draw the demand curves for bananas, both
before and after a new law requires banana peels to be recycled.
Assume that the recycling center...
Draw a single graph in Python showing the performance of both algorithms against the number of...
Draw a single graph in Python showing the performance of both
algorithms against the number of elements (100,000). Consider the
worst case scenario. In the graph we want to see: labeling of the
axes, a legend, a title and the graphs for both linear and binary
search, again correctly labeled. Explain what you see.
Draw a single graph in Python showing the performance of both a linear and binary search...
Draw a single graph in Python showing the performance of both a
linear and binary search algorithm against the number of elements
(100,000). Consider the worst case scenario. In the graph we want
to see: labeling of the axes, a legend, a title and the graphs for
both linear and binary search, again correctly labeled. Explain
what you see. Hint: Use Plot Functions (Plot Chart, series from
functions) from the H!de Editor.
Draw a graph having the given properties stated below, or explain why no such graph exists:...
Draw a graph having the given properties stated below, or
explain why no such graph exists: In each case assume simple graphs
(no self loops and no parallel edges) a. Six vertices each with
degree 3 b. Five vertices each with degree 3. c. Four vertices each
with degree 1. d. Six vertices and four edges. e. Four edges; four
vertices having degrees 1, 2, 3, and 4.
ADVERTISEMENT
ADVERTISEMENT
Latest Questions
- Use the internet to read more about journaling file systems such as NTFS, extfs2, and extfs3....
- Consider the quick sort algorithm. The quick sort algorithm is a divide and conquer approach which...
- Tesla 1. How to make these weaknesses into strengths? Burn through cash, high prices, bottlenecking/product delays,...
- Assignment # 12: Email Presentation Learning Objectives and Outcomes Design a PowerPoint presentation appropriate for middle...
- Identify which of the perspectives you believe is the BEST for accurately explaining human behavior and...
- What trade policies should a country adopt? why? Explain. Also, find some reference materials on this...
- In Java: Suppose you want to implement a Sudoku game that consists of 9x9 rows and...
ADVERTISEMENT