Question
In: Economics
5. Opportunity cost and production possibilities Eric is a skilled toy maker who is able to...
5. Opportunity cost and production possibilities
Eric is a skilled toy maker who is able to produce both cars and drums. He has 8 hours a day to produce toys. The following table shows the daily output resulting from various possible combinations of his time.
|
Choice |
Hours Producing |
Produced |
||
|---|---|---|---|---|
|
(Cars) |
(Drums) |
(Cars) |
(Drums) |
|
| A | 8 | 0 | 4 | 0 |
| B | 6 | 2 | 3 | 10 |
| C | 4 | 4 | 2 | 16 |
| D | 2 | 6 | 1 | 19 |
| E | 0 | 8 | 0 | 20 |
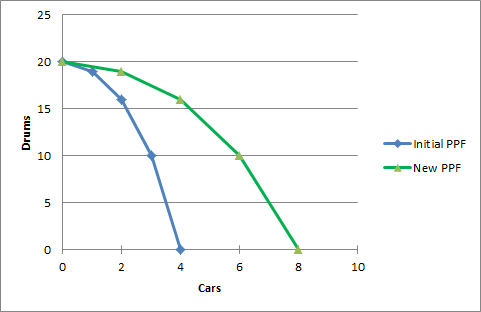
On the following graph, use the blue points (circle symbol) to plot Eric's initial production possibilities frontier (PPF).
Initial PPFNew PPF012345678302520151050DRUMSCARS
Suppose Eric is currently using combination D, producing one car per day. His opportunity cost of producing a second car per day is per day.
Now, suppose Eric is currently using combination C, producing two cars per day. His opportunity cost of producing a third car per day is per day.
From the previous analysis, you can determine that as Eric increases his production of cars, his opportunity cost of producing one more car .
Suppose Eric buys a new tool that enables him to produce twice as many cars per hour as before, but it doesn't affect his ability to produce drums. Use the green points (triangle symbol) to plot his new PPF on the previous graph.
Because he can now make more cars per hour, Eric's opportunity cost of producing drums is it was previously.
Solutions
Expert Solution
| Initial PPF | ||
| Cars | Drums | |
| A | 4 | 0 |
| B | 3 | 10 |
| C | 2 | 16 |
| D | 1 | 19 |
| E | 0 | 20 |
| New PPF | ||
| Cars | Drums | |
| A | 8 | 0 |
| B | 6 | 10 |
| C | 4 | 16 |
| D | 2 | 19 |
| E | 0 | 20 |
Suppose Eric is currently using combination D, producing one car per day. His opportunity cost of producing a second car per day is 3 (19-16) drums per day.
Now, suppose Eric is currently using combination C, producing two cars per day. His opportunity cost of producing a third car per day is 6 (16-10) drums per day.
From the previous analysis, you can determine that as Eric increases his production of cars, his opportunity cost of producing one more car increases .
Suppose Eric buys a new tool that enables him to produce twice as many cars per hour as before, but it doesn't affect his ability to produce drums. Use the green points (triangle symbol) to plot his new PPF on the previous graph.
(Refer above graph)
Because he can now make more cars per hour, Eric's opportunity cost of producing drums is twice/higher as previously.
 Rahul Sunny answered 8 months ago
Related Solutions
5. Opportunity cost and production possibilities Musashi is a skilled toy maker who is able to...
5. Opportunity cost and production possibilities Andrew is a skilled toymaker who is able to produce...
6. Given these production possibilities, what is the opportunity cost of expanding food production from 5...
What is the relationship between opportunity cost and the slope of the production possibilities frontier. What...
Use a production possibilities diagram for cars and other goods to illustrate the opportunity cost of...
Use a production possibilities diagram for cars and other goods to illustrate the opportunity cost of...
Discuss how the concept of opportunity cost is related to the concept of production possibilities frontier.
Increasing opportunity cost along a bowed-out production possibilities frontier occurs because?
The production possibilities frontier curves show the concepts of scarcity, choice, opportunity cost, efficiency and economic...
production possibilities frontier (PPF) to explain and illustrate the concepts “efficiency”, “trade-off”, “opportunity cost” and “unemployment”.
- Example: We are looking at the cholesterol levels of population of 200 healthy individuals. Cholesterol of...
- In an experiment on the Reaction of Magnesium with Hydrochloric Acid. What would be the effect...
- sort_employees(Employee emps[], int size) (40 pts) This function should sort the input array based on each...
- Write the program in JAVA. Make an undirected, but disconnected graph of at least 15 vertices...
- Teen Smoking Project CHAPTER 0. Preliminary Discussion Question: 1. What conjectures (educated guesses) could be made...
- In reviewing firm liquidity situations, lenders often count on the Quick Ratio (or Acid-Test ratio). Why...
- code a Java program that: Requests from the user for a text filename to read the...