Question
In: Math
Let X ∼ Pois(4), Y ∼ Pois(12), U ∼ Pois(3) be independent random variables. a) What...
Let X ∼ Pois(4), Y ∼ Pois(12), U ∼ Pois(3) be independent random variables.
-
a) What is the exact sampling distribution of W = X + Y + U?
-
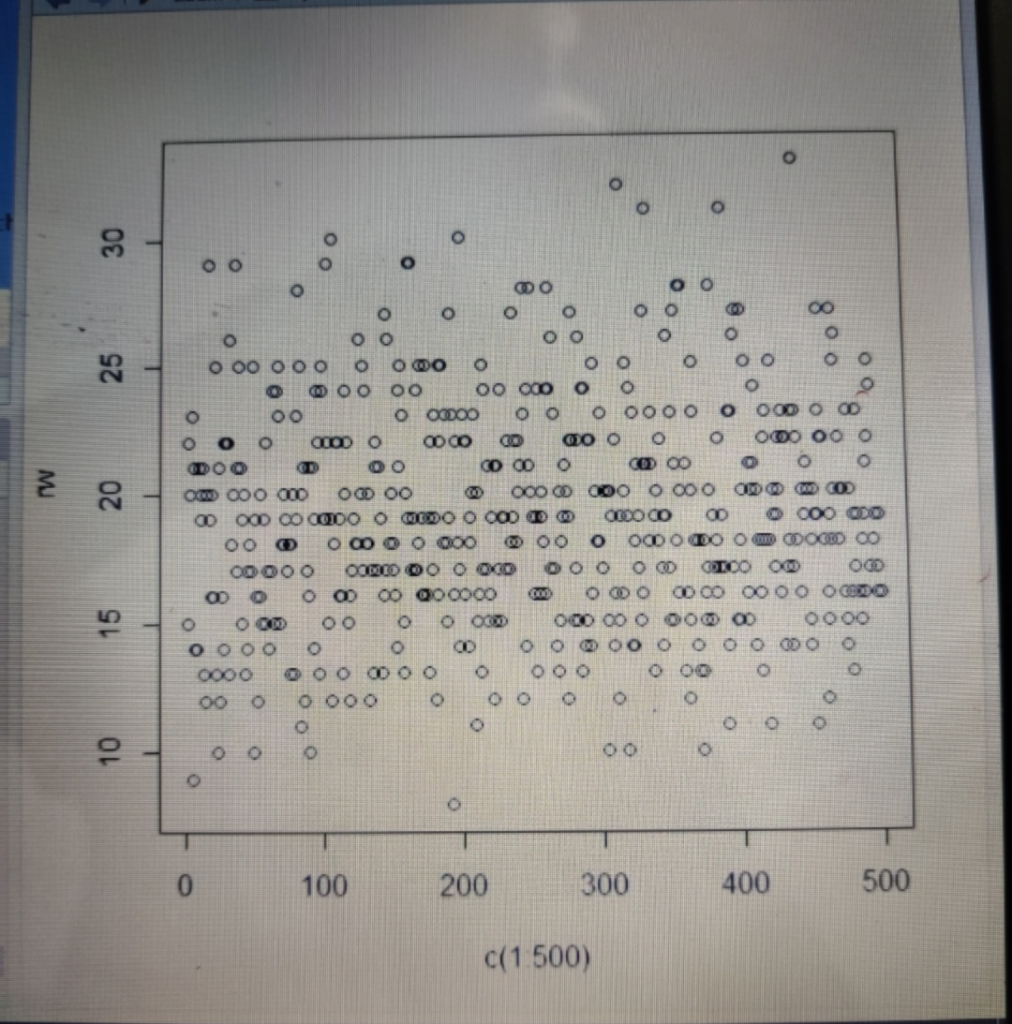
b) Use R to simulate the sampling distribution of W and plot your results. Check that the simulated mean and standard error are close to the theoretical mean and standard error.
-
c) Use the simulated sampling distribution to estimate P(W ≤ 14) and then check your estimate with an exact calculation.
Solutions
Expert Solution
 please
have a look at the R code
please
have a look at the R code
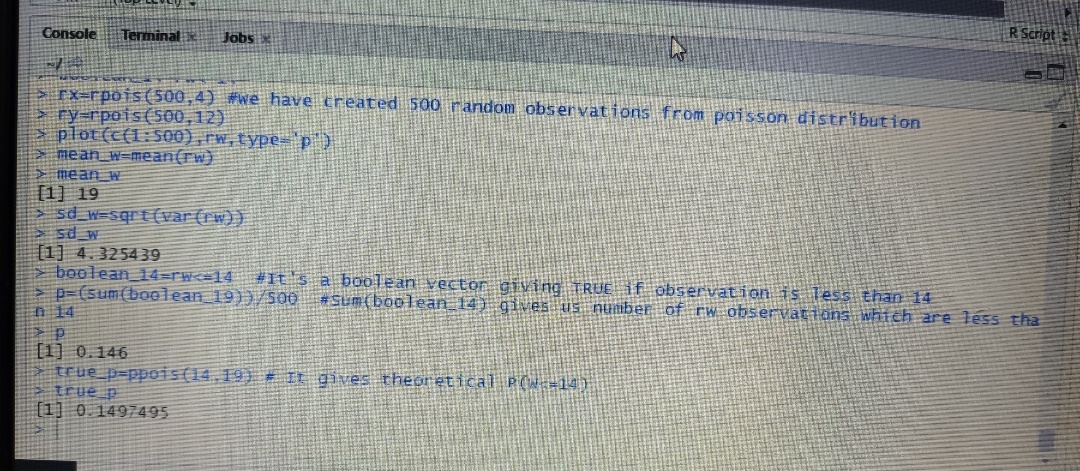
rx=rpois(500,4) #We have created 500 random observations from
poisson distribution
ry=rpois(500,12)
ru=rpois(500,3)
rw=rx+ry+ru
plot(c(1:500),rw,type='p')
mean_w=mean(rw)
mean_w
sd_w=sqrt(var(rw))
sd_w
boolean_14=rw<=14 #It's a boolean vector giving TRUE if
observation is less than 14
p=(sum(boolean_19))/500 #Sum(boolean_14) gives us number of rw
observations which are less than 14
p
true_p=ppois(14,19) # It gives theoretical P(W<=14)
true_p
"Now have a look at the output"
 simulated
mean is coming out to be theoretical mean and simulated standard
devaition (4.325) is very close to actual sd ( root(19)=4.3589).
The simulated probabolity (0.146) is very close to actual
probability (0.1497)
simulated
mean is coming out to be theoretical mean and simulated standard
devaition (4.325) is very close to actual sd ( root(19)=4.3589).
The simulated probabolity (0.146) is very close to actual
probability (0.1497)
 milcah answered 7 months ago
Related Solutions
1. Let X and Y be independent U[0, 1] random variables, so that the point (X,...
Let X and Y be two independent random variables such that X + Y has the...
Let X and Y be independent positive random variables. Let Z=X/Y. In what follows, all occurrences...
Let X and Y be two independent random variables. X is a binomial (25,0.4) and Y...
Let X, Y, and Z independent random variables with variance 4 and mean 1. Find the...
Let X, Y be independent exponential random variables with mean one. Show that X/(X + Y...
Let X and Y be independent Gaussian(0,1) random variables. Define the random variables R and Θ,...
1. Let X and Y be independent random variables with μX= 5, σX= 4, μY= 2,...
Let X, Y be independent random variables with X ∼ Uniform([1, 5]) and Y ∼ Uniform([2,...
Let X and Y be two independent random variables, and g : R2 --> R an...
- 1. Why is leadership outlook on security critical to employee buy-in at all levels? Give examples to...
- Students performed a procedure similar to Part III of this experiment (Analyzing a Vitamin Supplement for...
- The output of the function is a dictionary whose keys represent the bins and whose values...
- The shape of a graph of a binomial distribution depends on the value of both n...
- In 2012, cost per Medicare beneficiary did what?
- 3. A. What techniques can a firm use to optimize demand deposit holdings? B. How do...
- The half-life of mercury-197 is 64.1 hours. If a patient undergoing a kidney scan is given...