Question
In: Statistics and Probability
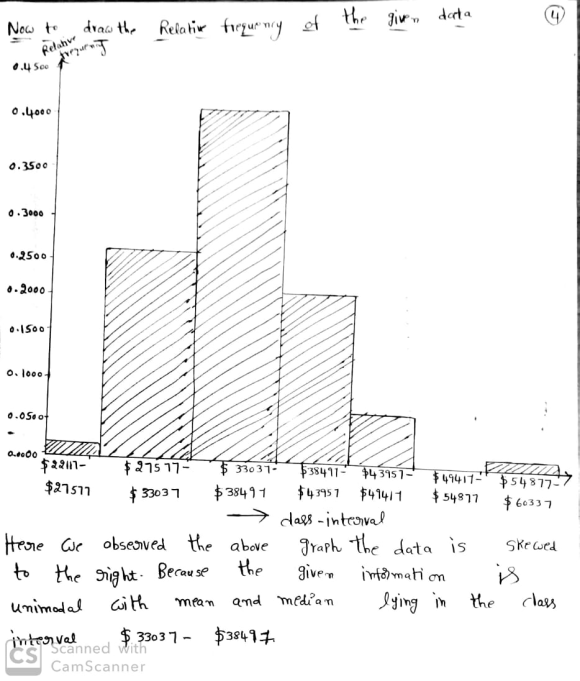
Create a histogram and relative frequency histogram for the data in table #2.2.10. Describe the shape...
Create a histogram and relative frequency histogram for the data in table #2.2.10. Describe the shape and any findings you can from the graph.
Table #2.2.10: Data of Median Income for Females
|
$31,862 |
$40,550 |
$36,048 |
$30,752 |
$41,817 |
$40,236 |
$47,476 |
$40,500 |
|
$60,332 |
$33,823 |
$35,438 |
$37,242 |
$31,238 |
$39,150 |
$34,023 |
$33,745 |
|
$33,269 |
$32,684 |
$31,844 |
$34,599 |
$48,748 |
$46,185 |
$36,931 |
$40,416 |
|
$29,548 |
$33,865 |
$31,067 |
$33,424 |
$35,484 |
$41,021 |
$47,155 |
$32,316 |
|
$42,113 |
$33,459 |
$32,462 |
$35,746 |
$31,274 |
$36,027 |
$37,089 |
$22,117 |
|
$41,412 |
$31,330 |
$31,329 |
$33,184 |
$35,301 |
$32,843 |
$38,177 |
$40,969 |
|
$40,993 |
$29,688 |
$35,890 |
$34,381 |
Solutions


 orchestra answered 3 years ago
Related Solutions
Create frequency table (including include class interval, frequency, relative frequency and cumulative relative frequency. ) and frequency...
Create frequency table (including include class
interval, frequency, relative frequency and cumulative relative
frequency. ) and frequency polygon.
Please explain HOW for a thumbs up!! TY
05
06
22
23
34
17
17
26
37
25
17
10
30
06
22
33
06
22
10
27
10
37
13
26
19
27
21
31
22
15
14
28
17
13
28
22
34
17
13
10
For the sample Data given create a frequency table using 6 classes. Find all relative and...
For the sample Data given create a frequency table using 6
classes.
Find all relative and cumulative frequencies
Data:94.7, 106.1, 117.5, 128.9, 135.5, 139.2, 142.3, 143.1,
144.5, 152.5, 156.4, 158.5, 159.6, 165.7, 166.5, 173.2, 175.5,
188.0, 199.0, 216.1
Use the frequencies found in the table above to sketch the
histogram for the distribution. Use the class boundaries for the
horizontal axis.
In r-studio, given X=rpois(200,2). Generate a poisson probability histogram with lambda=2 and a relative frequency histogram...
In r-studio, given X=rpois(200,2). Generate a poisson
probability histogram with lambda=2 and a relative frequency
histogram of the sample on the same graph-------- //answer this
only if youre familiar with R studio and know how to using it. not
handwritten//
Create a histogram of this data with 15 bins. Create a box plot of this data.
7, 9, 8, 11, 14, 7, 11, 17, 18, 12, 10, 9, 16, 17, 15, 13, 7,
12, 7, 8, 14, 16, 20, 12, 11, 14, 22, 8, 10, 14, 15, 20, 17, 14,
12, 22, 12, 15, 17, 16, 9, 11, 16, 18, 11, 12, 11, 9, 11, 9, 13, 7,
12, 9, 19, 9, 8, 15, 12, 16, 16, 20, 21, 9, 11, 17, 17, 8, 11, 7,
10, 17, 13, 15, 14, 11, 19,10, 11, 11, 9,...
what is correct About relative frequency distribution histogram(more can be choosen) 1. the total area of...
what is correct About relative frequency distribution
histogram(more can be choosen)
1. the total area of all bars is equal to 1
2. the trial area of all bars is equal to the number of values in a
sample
3. the total height of all bars are equal to 1.
4. the height of the bars highly depends on number of bins
5. the height of a bar is a percent values in the corresponding bin
divided to its width...
Below is a data set presented in a Frequency Table Data Value Frequency Data value. Frequency...
Below is a data set presented in a Frequency Table Data Value
Frequency
Data value. Frequency
2 64
4 68
9 18
10 33
14 117
Find the following for the data set above: a.) Mode = b.) Median
= c.) Mean = (Round to TWO decimal places)
There are several ways to describe data like the Histogram; what is the Histogram? Discuss how...
There are several ways to describe data like the
Histogram; what is the Histogram? Discuss how to use Excel to
produce Histogram and what can you use it for?
What is descriptive statistics? How can you use
descriptive statistics through Analysis Tool Pack add-in in
Excel? Discuss how to use Descriptive Statistics to
produce measures of center or dispersion? Can these be sued to
support decision making? How?
State whether a cumulative frequency, relative frequency, relative percent, cumulative relative frequency, or cumulative percent is...
State whether a cumulative frequency, relative
frequency, relative percent, cumulative relative frequency, or
cumulative percent is most appropriate for describing the
following situations. For cumulative distributions, indicate
whether these should be summarized from the top
down or from bottom up.
a. The number of symptoms of stress (ranging between 0
and 12 symptoms) experienced by 180 war veterans.
b. The number of calories in school lunches in a sample
of 32 local middle schools.
c. The number of hours of...
State whether a cumulative frequency, relative frequency, relative percent, cumulative relative frequency, or cumulative percent is...
State whether a cumulative frequency, relative
frequency, relative percent, cumulative relative frequency, or
cumulative percent is most appropriate for describing the
following situations. For cumulative distributions, indicate
whether these should be summarized from the top down or from bottom
up.
a. The frequency of business with at least 20 employees.
b. The frequency of college students with less than a 3.0
GPA.
c. The percentage of women completing 1, 2, 3, or 4 tasks
simultaneously.
d. The proportion of pregnancies...
what are the pros and con of frequency table, bar graph, histogram, pie graph, steam leaf...
what are the pros and con of frequency table, bar
graph, histogram, pie graph, steam leaf display, dot plot,
pictogram, frequency polygon, box plot, pareto graph
ADVERTISEMENT
ADVERTISEMENT
Latest Questions
- Two 10-cm-diameter charged rings face each other, 15cm apart. The left ring is charged to -29nC...
- Under what conditions would it be possible for an excise tax to have no efficiency cost...
- explain the difference between activities and financial statements of service businesses and merchandising businesses.
- 2. Compare and compare the matrix multiplication algorithm and the Floyd-Warshall algorithm to find all pairs...
- Q: 50.00 ml of 0.5216 M copper(II) nitrate solution is combined with 100.0 ml of 0.5580...
- This is a business law question. Explain how environmental laws regulate the use of toxic substances...
- A sky diver and her parachute system weigh a total of 800 N. She is falling...
ADVERTISEMENT