Question
In: Statistics and Probability
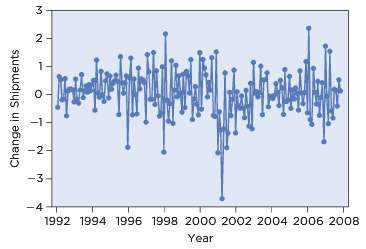
timeplot
The following timeplot shows a portion of the month-to-month changes in the value of shipments of computers and electronics (after seasonal adjustment, as used in the text of this chapter). The change from March to April 2001 was dramatically large and negative, producing the outlier in the timeplot.
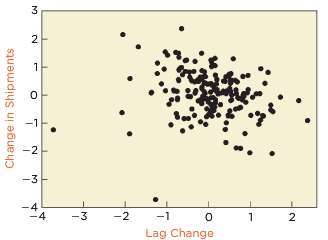
Let Yt denote the change in the value of the shipments. The scatterplot shown above graphs Yt on its lagged value Yt -1.
(a) Does this scatterplot suggest the presence of dependence between adjacent changes in the value of shipments?
(b) Where does the outlier produced by the large drop from March to April appear in the scatter-plot of Yt on Yt -1?
(c) Do you think that the outlier influences the estimated correlation between Yt and Yt -1?
(d) To remove the outlying change in shipments from the estimated correlation between Yt and Yt -1, how many data points need to be excluded from the scatterplot?
Solutions
Expert Solution
(a) The estimated correlation is weak and negative at r = −0.12.
(b) The one outlier in the time series shows up as the two separated points in the lower left corner of the scatterplot. Because the scatterplot effectively uses each value of yt twice (once on the vertical axis, and then once on the horizontal axis), an outlier in a time series appears as two points in the scatterplot of yt on yt−1.
(c) Yes. The pair of points associated with the outlier produce a positive direction to the correlation, whereas the main cluster has a negative slope. Without the pair from the outlier, the correlation falls to −0.26.
(d) One has to exclude two points from the scatterplot.
 Raffay answered 3 years ago
Related Solutions
- 2. a. Choose all of the following that apply to DynamoDB: (a) DynamoDB is part of...
- I asked this question before, but I'm wondering if there are any other ways to do...
- Can you please Describe your actions as the Manager, and how you would manage the project...
- Suppose we have a collection of n different subsets of the set { 1, 2, ...,...
- def read_list(): """ This function should ask the user for a series of integer values (until...
- If two slits are separated by .25cm and the slit to screen is 1m, what is...
- Determine the oxidation number (oxidation state) for the indicated element in each of the following compounds....