Question
In: Statistics and Probability
Consider the following data for two variables, x and y.
Consider the following data for two variables, x and y.
x 2 3 4 5 7 7 7 8 9
y 4 5 4 6 4 6 9 5 11
a. Does there appear to be a linear relationship between x and y? Explain.(f-test, to do f-test for the overall significance)
b. Develop the estimated regression equation relating x and y.
c. Plot the standardized residuals versus yˆ for the estimated regression equation developed in part (b). Do the model assumptions appear to be satisfied? Explain.
d. Perform a logarithmic transformation on the dependent variable y. Develop an estimated regression equation using the transformed dependent variable. Do the model assumptions appear to be satisfied by using the transformed dependent variable? Does a reciprocal transformation work better in this case? Explain.
Solutions
Expert Solution
a. By plotting scatter plot between the two variables x and y we can judge whether the relationship between the two variables is linear or not
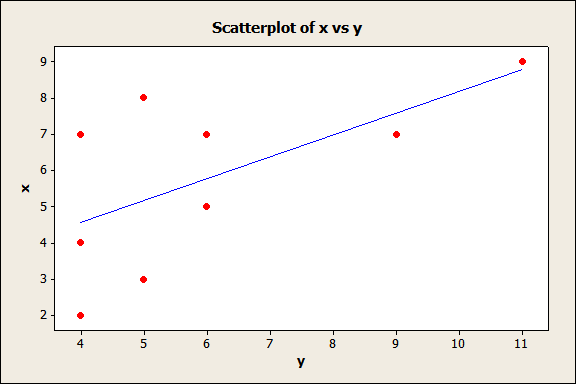
In the above plot the relation seems not perfect linear.
b) The estimated regression equation between
the two variables is
x = 2.15 + 0.604 y
c) The standardized residual plot is given below

it does not seem the assumption of independence of residuals and Homoscedasticity of residuals is not met. As the residuals are wide in the start of x axes and shrinks with the increase in the value at x axes.
F.test for the above model is
| Analysis of Variance | |||||
| Source | DF | SS | MS | F | P.Value |
| Regression | 1 | 17.521 | 17.521 | 4.37 | 0.075 |
| Residual | 7 | 28.035 | 4.005 | ||
| Total | 8 | 45.556 | |||
d) The regression equation is
x = - 1.28 + 9.40 ln(y) where ln(y) is
logey

The model variables seems to be bit more satisfying then with out log transformation.
The F Test results are as below for log transformed model
| Analysis of Variance | |||||
| Source | DF | SS | MS | F | P.Value |
| Regression | 1 | 17.575 | 17.575 | 4.4 | 0.074 |
| Residual | 7 | 27.98 | 3.997 | ||
| Total | 8 | 45.556 | |||
Now if we check with the reciprocal transformation following
The regression equation is
x = 10.4 - 24.6 rep(Y) Where rep(y) is reciprocal of variable y i,e
(1/y)

It seems to be more satisfying then the precious one
F.test for reciprocal model
| Analysis of Variance | |||||
| Source | DF | SS | MS | F | P.Value |
| Regression | 1 | 17.046 | 17.046 | 4.19 | 0.08 |
| Residual | 7 | 28.51 | 4.073 | ||
| Total | 8 | 45.556 | |||
 orchestra answered 3 years ago
Related Solutions
Consider the following data for two variables, x and y.
A statistical program is recommended. Consider the following data for two variables, x and y. x...
A statistical program is recommended. Consider the following data for two variables, x and y. x...
A statistical program is recommended. Consider the following data for two variables, x and y. x...
A statistical program is recommended. Consider the following data for two variables, x and y. x...
A statistical program is recommended. Consider the following data for two variables, x and y. xi...
Consider the following data for two variables, x and y. x 10 34 20 11 24...
Consider the following data for two variables, x and y. x 9 32 18 15 26...
Consider the following data for two variables, x and y. x 22 24 26 30 35...
Consider the following data for two variables, x and y. x 22 24 26 30 35...
- Two 10-cm-diameter charged rings face each other, 15cm apart. The left ring is charged to -29nC...
- Under what conditions would it be possible for an excise tax to have no efficiency cost...
- explain the difference between activities and financial statements of service businesses and merchandising businesses.
- 2. Compare and compare the matrix multiplication algorithm and the Floyd-Warshall algorithm to find all pairs...
- Q: 50.00 ml of 0.5216 M copper(II) nitrate solution is combined with 100.0 ml of 0.5580...
- This is a business law question. Explain how environmental laws regulate the use of toxic substances...
- A sky diver and her parachute system weigh a total of 800 N. She is falling...