Question
In: Statistics and Probability
Color Preference. What is your favorite color? A large survey of countries indicated that most people...
Color Preference. What is your favorite color? A large survey of countries indicated that most people prefer the color blue. About 26% of the population claim blue as their favorite color. Suppose you randomly sample of 56 college students and nine of them said their favorite color is blue. Does this information imply that the color preference of all college students is different from that of the general population? Use a significance level of 10%. a. What is the null and alternative hypotheses (in symbols) b. Identify your variables c. Show which formula you should use d. Calculate the test statistic e. Sketch the distribution, identify the critical value(s), shade the critical region, plot your calculated value on the distribution f. Interpret your findings within the context of the problem
Solutions
Expert Solution
a) null and alternative hypothesis : A null hypothesis is a hypothesis that says there is no statistical significance between the two variables. It is usually the hypothesis a researcher or experimenter will try to disprove or discredit.The null hypothesis states that a population parameter (such as the mean, the standard deviation, and so on) is equal to a hypothesized value Analternative hypothesis is one that states there is a statistically significant relationship between two variables.The alternative hypothesis states that a population parameter is smaller, greater, or different than the hypothesized value in the null hypothesis
H0 = null hypothesis ( x = mean)
Ha = alternative hypothesis. ( x is not eaual to mean)
b) variable identify : in a country 26% people claim blue , so, P1 is 26/100 = 0.26
within 56 college student nine claim blue so. P2 is 9/56 = 0.16
so, color preference of all college student is different from that of the general population.
c)
formula: z score use at 10% significane level.
Z =  P1 = 0.26
P2 = 0.16
SE is standard error of the difference = 
n1 = 140
n2 = 56
d) test statistic : z value = 1.52
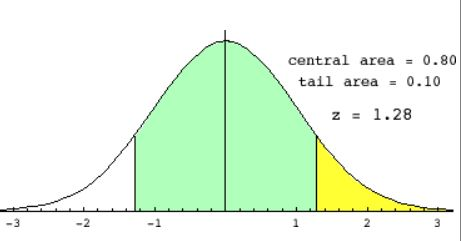
e) sketch: 10 % significance level one tail tes yellow color is critical region critical value is 1.28 calculated value is 1.52
f) calculated value is greater than critical value so ,color preference is significant of all college students is different from that of the general population at one tail 10% significance level. but not significant in two tail test beacuse calculated value is less (1.52) than the critical value(1.64).
 orchestra answered 3 years ago
Related Solutions
What is your favorite color? A large survey of countries, including the United States, China, Russia,...
What is your favorite color? A large survey of countries, including the United States, China, Russia,...
What is your favorite color? A large survey of countries, including the United States, China, Russia,...
What is your favorite color? A large survey of countries, including the United States, China, Russia,...
What is your favorite color? A large survey of countries, including the United States, China, Russia,...
What is your favorite color? A large survey of countries, including the United States, China, Russia,...
What is your favorite color? A large survey of countries, including the United States, China, Russia,...
What is your favorite color? A large survey of countries, including the United States, China, Russia,...
Most people like the color blue; it is the favorite color of many people. Do we...
In a large survey, third graders were asked what their favorite color is. The results are...
- Graph a Monopoly. Compare the price, quantity, and ATC of a monopoly with a perfectly competitive...
- Problem 18-12 Various shareholders' equity topics; comprehensive [LO18-1, 18-4, 18-5, 18-6, 18-7, 18-8] Part A In...
- Hello There, This is discussion Question For Advanced Database Systems Question: (a) Please define what a...
- Physicians at a clinic gave what they thought were drugs to 860860 patients. Although the doctors...
- On January 1, 2018, bonds with a face value of $ 79,000 were sold. The bonds...
- How do I make this sort in true alphabetical order instead of ascii(ABCabc) order? I am...
- As a healthcare provider in physical therapy, athletic training, or as an exercise scientist and personal...