Question
In: Statistics and Probability
Let X and Y equal the number of milligrams of tar in filtered and nonfiltered cigarettes,...
- Let X and Y equal the number of milligrams of
tar in filtered and nonfiltered cigarettes, respectively. Assume
that ?~?(??, ?2) and ?~?(??,
?2). We shall test the null hypothesis ?0:
?? = ?? against the alternative hypothesis
??: ?? < ?? using independent
random samples of sizes n = 9 and m = 11
observations from X and Y, respectively.
- Define the test statistic for testing the above hypothesis, and the rejection region that is associated with an ? = 0.01 significance level. Sketch a figure illustrating this rejection region.
- Given the n = 9 observations on X: 0.9, 1.1, 0.1, 0.7, 0.4, 0.9, 0.8, 1.0, 0.4; and the m = 11 observations on Y: 1.5, 0.9, 1.6, 0.5, 1.4, 1.9, 1.0, 1.2, 1.3, 1.6, 2.1, calculate the value of the test statistic and clearly state your conclusion. Locate the value of the test statistic on your figure.
- What is the p-value of this test?
Solutions
Expert Solution
The sample size is n = 9 . The provided sample data along with the data required to compute the sample mean and sample variance are shown in the table below:
| X | X2 | |
| 0.9 | 0.81 | |
| 1.1 | 1.21 | |
| 0.1 | 0.01 | |
| 0.7 | 0.49 | |
| 0.4 | 0.16 | |
| 0.9 | 0.81 | |
| 0.8 | 0.64 | |
| 1.0 | 1 | |
| 0.4 | 0.16 | |
| Sum = | 6.3 | 5.29 |
The sample mean is computed as follows:

Also, the sample variance is

Therefore, the sample standard deviation s is

The sample size is n = 11. The provided sample data along with the data required to compute the sample mean and sample variance are shown in the table below:
| Y | Y2 | |
| 1.5 | 2.25 | |
| 0.9 | 0.81 | |
| 1.6 | 2.56 | |
| 0.5 | 0.25 | |
| 1.4 | 1.96 | |
| 1.9 | 3.61 | |
| 1.0 | 1 | |
| 1.2 | 1.44 | |
| 1.3 | 1.69 | |
| 1.6 | 2.56 | |
| 2.1 | 4.41 | |
| Sum = | 15 | 22.54 |
The sample mean is computed as follows:

Also, the sample variance is

Therefore, the sample standard deviation s is

(1) Null and Alternative Hypotheses
The following null and alternative hypotheses need to be tested:
Ho: μ1 = μ2
Ha: μ1 < μ2
This corresponds to a left-tailed test, for which a t-test for two population means, with two independent samples, with unknown population standard deviations will be used.
(2) Rejection Region
Based on the information provided, the significance level is α=0.01, and the degrees of freedom are df = 18. In fact, the degrees of freedom are computed as follows, assuming that the population variances are equal:
Hence, it is found that the critical value for this left-tailed test is t_c = -2.552 , for α=0.01 and df = 18df=18.
(3) Test Statistics
Since it is assumed that the population variances are equal, the t-statistic is computed as follows:

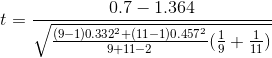
t = -3.637
(4) Decision about the null hypothesis
Since it is observed that t = -3.637 < t_c = -2.552, it is then concluded that the null hypothesis is rejected.
Using the P-value approach: The p-value is p = 0.0009, and since p = 0.0009 < 0.01p=0.0009<0.01, it is concluded that the null hypothesis is rejected.
(5) Conclusion
It is concluded that the null hypothesis Ho is rejected. Therefore, there is enough evidence to claim that population mean μ1 is less than μ2, at the 0.01 significance level.
 orchestra answered 3 years ago
Related Solutions
Are cigarettes bad for people? Cigarette smoking involves tar, carbon monoxide, and nicotine (measured in milligrams)....
Let X be the number of heads and let Y be the number of tails in...
2. A. Find the five-number summary for the Tar content of the sample of cigarettes. List...
Let x be the number of different research programs, and let y be the mean number...
Let X be a random variable that is equal to the number of times a 5...
Let X be the event that the first number is even. Let Y be the event...
The effect of applying x milligrams of drug A and y milligrams of drug B is measured by
Let x be per capita income in thousands of dollars. Let y be the number of...
Let x be per capita income in thousands of dollars. Let y be the number of...
Let x be per capita income in thousands of dollars. Let y be the number of...
- Students performed a procedure similar to Part III of this experiment (Analyzing a Vitamin Supplement for...
- The output of the function is a dictionary whose keys represent the bins and whose values...
- The shape of a graph of a binomial distribution depends on the value of both n...
- In 2012, cost per Medicare beneficiary did what?
- 3. A. What techniques can a firm use to optimize demand deposit holdings? B. How do...
- The half-life of mercury-197 is 64.1 hours. If a patient undergoing a kidney scan is given...
- Double bonds react with Br2 to form a dibromide. Isobutylene undergoes cationic polymerization under conditions where...