Question
In: Math
(a) Estimate the area under the graph of f(x) = 3 + 4x2 from x =...
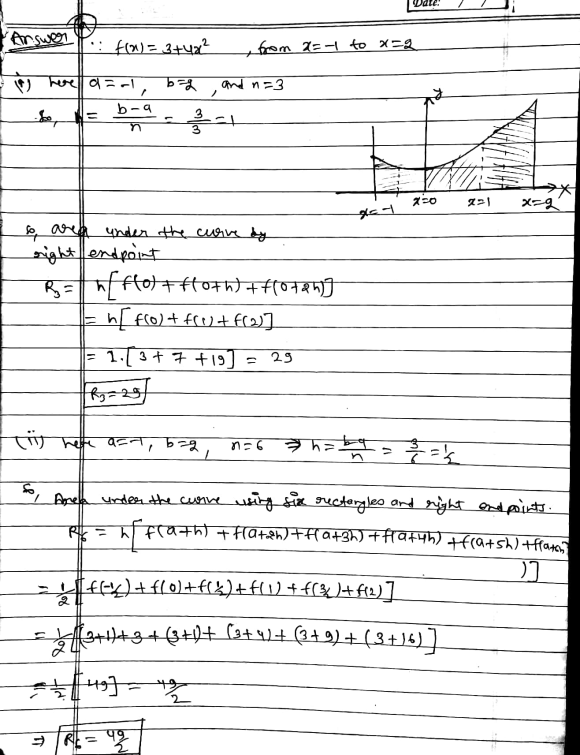
(a) Estimate the area under the graph of f(x) = 3 + 4x2 from x = −1 to x = 2 using three rectangles and right endpoints.
R3 =
Then improve your estimate by using six rectangles.
R6 =
Sketch the curve and the approximating rectangles for R3 andR6.
(b) Repeat part (a) using left endpoints.
| L3 | = | |
| L6 | = |
Sketch the curve and the approximating rectangles for L3 and L6.
(c) Repeat part (a) using midpoints.
| M3 | = |
| M6 | = |
Sketch the curve and the approximating rectangles for M3 and M6.
(d) From your sketches in parts (a)-(c), which appears to be the best estimate?
A) L6
B) M6
C) R6
Solutions


 milcah answered 4 years ago
Related Solutions
(a) Estimate the area under the graph of f(x) = 3 + 4x2 from x =...
(a) Estimate the area under the graph of
f(x) = 3 +
4x2 from x = −1 to
x = 2
using three rectangles and right endpoints.
R3 =
Then improve your estimate by using six rectangles.
R6 =
Sketch the curve and the approximating rectangles for
R3.
Sketch the curve and the approximating rectangles for
R6.
(b) Repeat part (a) using left endpoints.
L3
=
L6
=
Sketch the curve and the approximating rectangles for
L3.
Sketch the curve...
Estimate to the hundredth the area from 0 to 2 under the graph of f(x) =...
Estimate to the hundredth the area from 0 to 2 under the graph
of
f(x) = e^x − 3
Using 4 approximating rectangles and midpoints endpoints.
(a) Estimate the area under the graph of f(x) = 4 cos(x) from x = 0...
(a) Estimate the area under the graph of f(x) = 4 cos(x) from x
= 0 to x = π/2 using four approximating rectangles and right
endpoints. (Round your answers to four decimal places.) R4 = Sketch
the graph and the rectangles. WebAssign Plot WebAssign Plot
WebAssign Plot WebAssign Plot Is your estimate an underestimate or
an overestimate? underestimate overestimate (b) Repeat part (a)
using left endpoints. L4 = Sketch the graph and the rectangles.
WebAssign Plot WebAssign Plot WebAssign...
Estimate the area under the graph of f ( x ) = 1(x + 1) over...
Estimate the area under the graph of f ( x ) = 1(x + 1) over the
interval [ 3 , 5 ] using two hundred approximating rectangles and
right endpoints
R n =
Repeat the approximation using left endpoints
L n =
Use finite approximation to estimate the area under the graph f(x)= 8x2 and above graph f(x)...
Use finite approximation to estimate the area under the graph
f(x)= 8x2 and above graph f(x) = 0 from X0 =
0 to Xn = 16 using
i) lower sum with two rectangles of equal width
ii) lower sum with four rectangles of equal width
iii) upper sum with two rectangles of equal width
iv) upper sum with four rectangle of equal width
Estimate the area under the graph of f(x) =5 sqrt x. from x=0 to x=4 using...
Estimate the area under the graph of f(x) =5 sqrt x. from x=0 to
x=4 using four approximating rectangles and right endpoints. sketch
the graph and rectangles. is your estimate an underestimate or
overestimate? Repeat using left endpoints
1) Find an estimate for the area under the graph of f(x)=x^2 from x=0 to x=8...
1) Find an estimate for the area under the graph of f(x)=x^2
from x=0 to x=8 using four rectangles and:
a) left end points
b) right end points
c) mid points
2) Find the volume of a solid obtained by rotating about the
x-axis the region bounded by y=x^3 and y=2x.
Sketch the region, the solid, and a typical disk or washer.
Estimate the area (A) between the graph of the function F(X)=3/X and the interval [1,2]. Use an...
Estimate the area (A) between the graph of the function
F(X)=3/X and the interval [1,2]. Use an approximation
scheme with N= 2, 5 rectangles. Use the right endpoints.
If your calculating utility will perform automatic summations,
estimate the specified area using N=50 and N=100 rectangles.
Round your answers to three decimal places.
A2=
A5=
A10=
A50=
A100=
Estimate the area under the graph of f(x)=25−x^2 from x=0 to x=5 using 5 approximating rectangles...
Estimate the area under the graph of
f(x)=25−x^2
from x=0 to x=5 using 5 approximating rectangles and right
endpoints.
(B) Repeat part (A) using left endpoints.
(C) Repeat part (A) using midpoints.
Estimate the area A between the graph of the function f(x)= square root of x and...
Estimate the area A between the graph of the function f(x)=
square root of x and the interval [0,49]. Use an approximation
scheme with n=2,5, and 10 rectangles. Use the right
endpoints.
Round your answers to three decimal places.
A2=
A5=
A10=
Click
ADVERTISEMENT
ADVERTISEMENT
Latest Questions
- . 1. Provide an example of any two leading companies from the same industry, which are...
- Suppose Elon Musk is spectacularly successful, and electric vehicle technology follows the technology diffusion model we’ve...
- Starting from rest, a basketball rolls from the top to the bottom of a hill, reaching...
- Ray Company provided the following excerpts from its Production Department’s flexible budget performance report. (Round "rate...
- Give an examples of Altruism on a macro level, and micro level, and how the concept...
- QUESTION In process improvement efforts, quality costs or cost of quality is a means to quantify...
- Lightning is a great illustration from nature of the stunning application of statics and electric fields....
ADVERTISEMENT