Question
In: Statistics and Probability
How can one get the error bars for a plot? Are there error bars for both...
How can one get the error bars for a plot? Are there error bars
for both the horizontal and vertical
axes, or just the vertical axes? Explain.
A student is trying to calculate the volume of a metal sphere.
She measures the diameter to be 3.56
cm. The uncertainty in the ruler is 1 mm. What is the absolute
uncertainty in the volume
measurement?
Solutions
Expert Solution
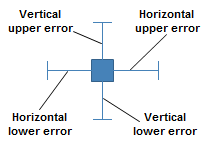
Error bars are used to indicate the estimated error in a measurement. In other words, an error bar indicates the uncertainty in a value. Bar charts and line charts can display vertical errors. Scatter plots can display both vertical and horizontal errors. The image below shows all four possible error bars on a scatter plot marker. This means that if you use reversed scales in a visualization, or change orientation of the bars in a bar chart, the error bars will also be reversed or change orientation respectively. For example, for a scatter plot with a reversed Y-axis, an upper vertical error will be displayed below the marker instead of above the marker. For a bar chart with horizontal bars and non-reversed scale, an upper horizontal error will be displayed to the right of the bar.


Related Solutions
(a) To get a feel for how ∆mixGm varies with χAB, plot it for the following...
how can CFO and CHRO benefit one another in an organization? what benefits can one get...
How can user error be controlled? Is it unavoidable?
What does it mean when a graph has large standard error bars?
I keep on get a redefinition error and an undefined error. Customer List (1) CustomerList() and...
Why am I getting this error using 000webhost , but I do not get this error...
Is it possible to minimize both the type 1 error and the type 2 error at...
Define error function and complementary error function, mathematically. Explain how these functions can be tabulated.
How does one get Alzheimers disease ?
what are the benefits and the costs of free trade and how these both get distributed...
- 2. a. Choose all of the following that apply to DynamoDB: (a) DynamoDB is part of...
- I asked this question before, but I'm wondering if there are any other ways to do...
- Can you please Describe your actions as the Manager, and how you would manage the project...
- Suppose we have a collection of n different subsets of the set { 1, 2, ...,...
- def read_list(): """ This function should ask the user for a series of integer values (until...
- If two slits are separated by .25cm and the slit to screen is 1m, what is...
- Determine the oxidation number (oxidation state) for the indicated element in each of the following compounds....
 orchestra answered 3 years ago