Question
In: Economics
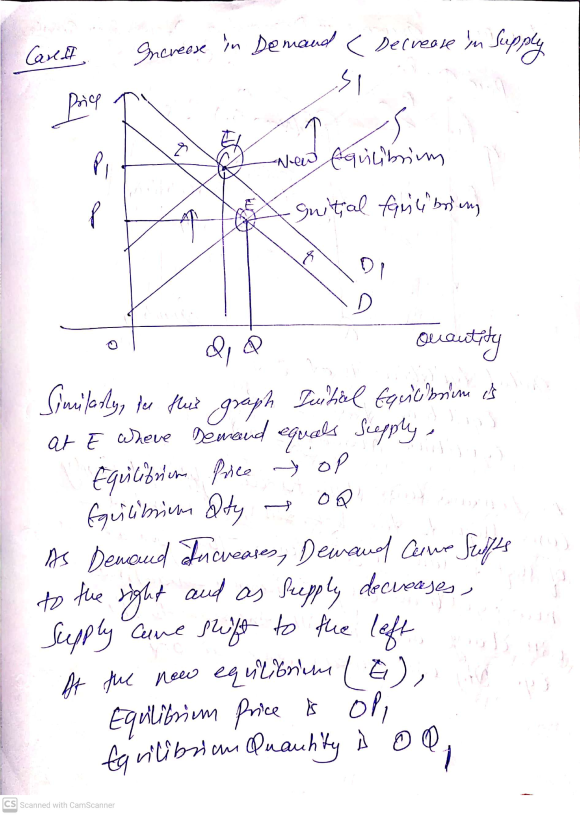
Use supply-demand diagrams to illustrate the situation in which demand increases and supply decreases at the...
Use supply-demand diagrams to illustrate the
situation in which demand increases and supply decreases at the
same
time. Indicate what the model predicts regarding the price change
and
quantity to equilibrium. Carefully label your diagram and
explain it. Discuss and explain completely.
Solutions


 Rahul Sunny answered 3 years ago
Related Solutions
In the space below, use a supply and demand diagrams to illustrate the situation where demand...
In the space below, use a supply and demand diagrams to
illustrate the situation where demand increases and supply also
increases (at the same time). Indicate what the model predicts
about the change in equilibrium price and quantity. Carefully label
your diagram and explain it. (HINT: three graphs) Explain
all answers fully and give concluding sentences.
Use four separate supply and demand diagrams to illustrate the effects of the following possible shocks...
Use four separate supply and demand diagrams to
illustrate the effects of the following possible shocks on the
equilibrium price and quantity of avocados. In each diagram clearly
indicate the initial equilibrium price and quantity with a
P1 and Q1 and the new equilibrium price and
quantity after the shock P2 and Q2
A.) A major scientific study shows that people who regularly
consume avocados live on average seven years longer than those who
don’t consume avocados.
B.) Farmers produce...
when the law of increasing cost , the demand decreases and supply increases ? for example...
when the law of increasing cost , the demand decreases and supply
increases ? for example , shortage of santizer ? so, the price
increases ? can you help explains ?
If the Federal Reserve decreases the rate at which it increases the money supply, then unemployment...
If the Federal Reserve decreases the rate at which it increases
the money supply, then unemployment is higher in __________.
Group of answer choices
the long run and the short run
the long run but not the short run
the short run but not the long run
neither the short run nor the long run
Explain the effects of each situation below on the market demand and supply using suitable diagrams....
Explain the effects of each situation below on the market demand
and supply using suitable diagrams.
A new skirt design which increases the preferences for the
Asshanas clothing brand among teenagers.
A government ban on the supply of meat from New
Zealand.
The increased price of chicken feed and hos this affects the
chicken
market.
The effects of the Goods and Services Tax (GST) on smartphone
purchases.
Explain the effects of each situation below on the market demand and supply using suitable diagrams....
Explain the effects of each situation below on the market demand
and supply using suitable diagrams.
a. A new skirt design which increases the preferences for the
Asshanas clothing brand among teenagers.
b. A government reduce the import rate on the supply of meat from
New Zealand.
c. The decrease in price of chicken feed and hos this affects the
chicken market.
d. The effects of the Goods and Services Tax (GST) on smartphone
purchases.
1. Draw supply and/or demand diagrams to illustrate how each of the following events would affect...
1. Draw supply and/or demand diagrams to illustrate how each of
the following events would affect the market for wood. In each case
show the original price and quantity (Po and
Qo) and the new price and quantity (P1 and
Q1).
A decrease in the quantity
demanded
In an attempt to reduce fire hazards, several American cities
adopt regulations that restrict the use of wood products in the
construction of houses.
The government of BC takes steps to preserve more...
Illustrate graphically an aggregate demand/aggregate supply of an economy in a recessionary situation. Show the GDP...
Illustrate graphically an aggregate demand/aggregate supply of
an economy in a recessionary situation. Show the GDP gap
graphically. How can the Federal help close the recessionary gap
moving the economy back toward full employment using monetary
policy? Account for the role of the money supplier in the answer.
Graphically show the prescription chosen. What is the potential
impact on interest rates, budget deficit and trade deficit if
applicable? Explain your answer.
Given downward-sloping demand for labor and upward-sloping supply of labor, explain if wage increases, decreases, or...
Given downward-sloping demand for labor and upward-sloping
supply of labor, explain if wage increases, decreases, or has an
indeterminate effect if (a) the number of qualified workers
decreases and (b) the number of employers increases. Answer (a) and
(b) as two different cases.
In the scenario below, use a supply and demand diagram to illustrate the effect of the...
In the scenario below, use a supply and demand diagram to
illustrate the effect of the given shock on the equilibrium price
and quantity in the specified competitive market. Explain whether
there is a shift in the demand curve, the supply curve, or
neither
AirAsia X (AirAsia’s long-haul, low-cost international carrier)
defers delivery of 78
Airbus SE A330neo planes. Show the effect of this cancellation on
Airbus planes’
demand. I want proper answers with evidence regarding the effects
on AirAsia...
ADVERTISEMENT
ADVERTISEMENT
Latest Questions
- Two 10-cm-diameter charged rings face each other, 15cm apart. The left ring is charged to -29nC...
- Under what conditions would it be possible for an excise tax to have no efficiency cost...
- explain the difference between activities and financial statements of service businesses and merchandising businesses.
- 2. Compare and compare the matrix multiplication algorithm and the Floyd-Warshall algorithm to find all pairs...
- Q: 50.00 ml of 0.5216 M copper(II) nitrate solution is combined with 100.0 ml of 0.5580...
- This is a business law question. Explain how environmental laws regulate the use of toxic substances...
- A sky diver and her parachute system weigh a total of 800 N. She is falling...
ADVERTISEMENT