Question
In: Math
Each box of Healthy Crunch breakfast cereal contains a coupon entitling you to a free package...
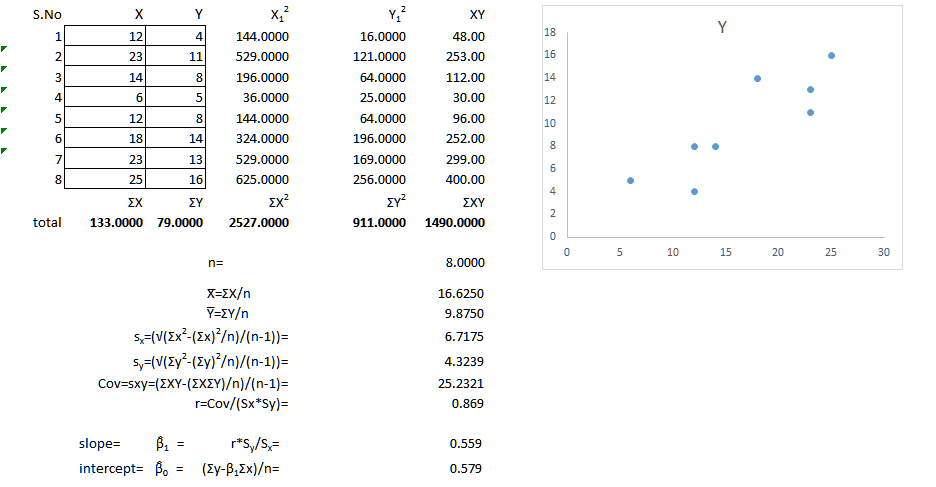
Each box of Healthy Crunch breakfast cereal contains a coupon entitling you to a free package of garden seeds. At the Healthy Crunch home office, they use the weight of incoming mail to determine how many of their employees are to be assigned to collecting coupons and mailing out seed packages on a given day. (Healthy Crunch has a policy of answering all its mail on the day it is received.) Let x = weight of incoming mail and y = number of employees required to process the mail in one working day. A random sample of 8 days gave the following data.
| x (lb) | 12 | 23 | 14 | 6 | 12 | 18 | 23 | 25 |
| y (Number of employees) | 4 | 11 | 8 | 5 | 8 | 14 | 13 | 16 |
In this setting we have Σx = 133, Σy = 79, Σx2 = 2527, Σy2 = 911, and Σxy = 1490.
(a) Find x, y, b, and the equation of the least-squares line. (Round your x and y to two decimal places. Round your least-squares estimates to four decimal places.)
| x | = | |
| y | = | |
| b | = | |
| ŷ | = | + x |
(b) Draw a scatter diagram displaying the data. Graph the
least-squares line on your scatter diagram. Be sure to plot the
point (x, y).
(c) Find the sample correlation coefficient r and the
coefficient of determination. (Round your answers to three decimal
places.)
| r = | |
| r2 = |
What percentage of variation in y is explained by the
least-squares model? (Round your answer to one decimal
place.)
%
(d) Test the claim that the population correlation coefficient
ρ is positive at the 1% level of significance. (Round your
test statistic to three decimal places.)
t =
Find or estimate the P-value of the test statistic.
P-value > 0.250
0.125 < P-value < 0.250
0.100 < P-value < 0.125
0.075 < P-value < 0.100
0.050 < P-value < 0.075
0.025 < P-value < 0.050
0.010 < P-value < 0.025
0.005 < P-value < 0.010
0.0005 < P-value < 0.005
P-value < 0.0005
Conclusion
Reject the null hypothesis, there is sufficient evidence that ρ > 0.
Reject the null hypothesis, there is insufficient evidence that ρ > 0.
Fail to reject the null hypothesis, there is sufficient evidence that ρ > 0.
Fail to reject the null hypothesis, there is insufficient evidence that ρ > 0.
(e) If Healthy Crunch receives 11 pounds of mail, how many
employees should be assigned mail duty that day? (Round your answer
to two decimal places.)
employees
(f) Find Se. (Round your answer to three
decimal places.)
Se =
(g) Find a 95% for the number of employees required to process mail
for 11 pounds of mail. (Round your answer to two decimal
places.)
| lower limit | employees |
| upper limit | employees |
(h) Test the claim that the slope β of the population
least-squares line is positive at the 1% level of significance.
(Round your test statistic to three decimal places.)
t =
Find or estimate the P-value of the test statistic.
P-value > 0.250
0.125 < P-value < 0.250
0.100 < P-value < 0.125
0.075 < P-value < 0.100
0.050 < P-value < 0.075
0.025 < P-value < 0.050
0.010 < P-value < 0.025
0.005 < P-value < 0.010
0.0005 < P-value < 0.005
P-value < 0.0005
Conclusion
Reject the null hypothesis, there is sufficient evidence that β > 0.
Reject the null hypothesis, there is insufficient evidence that β > 0.
Fail to reject the null hypothesis, there is sufficient evidence that β > 0.
Fail to reject the null hypothesis, there is insufficient evidence that β > 0.
(i) Find an 80% confidence interval for β and interpret
its meaning. (Round your answers to three decimal places.)
| lower limit | |
| upper limit |
Interpretation
For each additional pound of mail, the number of employees needed increases by an amount that falls within the confidence interval.
For each additional pound of mail, the number of employees needed increases by an amount that falls outside the confidence interval.
For each less pound of mail, the number of employees needed increases by an amount that falls within the confidence interval.
For each less pound of mail, the number of employees needed increases by an amount that falls outside the confidence interval.
Solutions
Expert Solution
a)
| X̅=ΣX/n = | 16.63 |
| Y̅=ΣY/n = | 9.88 |
b=0.5592
| ŷ = | 0.5789+0.5592x |
c)
| r=Cov/(Sx*Sy)= | 0.869 |
| coefficient of determination r2 = | 0.755 | |||
percentage of variation in y is explained by the least-squares model=75.5%
d)
| test statistic t = | r*(√(n-2)/(1-r2))= | 4.296 | ||
0.0005 < P-value < 0.005
Reject the null hypothesis, there is sufficient evidence that ρ > 0.
e)
| predicted value = | 6.73 | |||
f)
| Se =√(SSE/(n-2))= | 2.314 | |||
g)
lower =0.46
upper =13.00
h)
| test statistic t = | r*(√(n-2)/(1-r2))= | 4.296 | ||
0.0005 < P-value < 0.005
Reject the null hypothesis, there is sufficient evidence that β> 0.
i)
lower =0.372
upper =0.747
For each additional pound of mail, the number of employees needed increases by an amount that falls within the confidence interval.
 milcah answered 3 weeks ago
Related Solutions
Each box of Healthy Crunch breakfast cereal contains a coupon entitling you to a free package...
Each box of Healthy Crunch breakfast cereal contains a coupon entitling you to a free package...
Each box of Healthy Crunch breakfast cereal contains a coupon entitling you to a free package...
A machine that is programmed to package 2.35 pounds of cereal in each cereal box is...
A machine that is programmed to package 1.20 pounds of cereal in each cereal box is...
Cho Co. includes one coupon in each box of cereal it sells. In return for 5...
The Kenton Food Company wished to test four different package designs for a new breakfast cereal....
Steele Breakfast Foods Inc. produces a popular brand of raisin bran cereal. The package indicates it...
Suppose you work for Kellogg's breakfast cereal division. Your job to estimate demand for Kellogg's breakfast...
Ariana Corporation includes two coupons in each box of cereal box and 9 coupons are redeemed...
- Assignment # 12: Email Presentation Learning Objectives and Outcomes Design a PowerPoint presentation appropriate for middle...
- Identify which of the perspectives you believe is the BEST for accurately explaining human behavior and...
- What trade policies should a country adopt? why? Explain. Also, find some reference materials on this...
- In Java: Suppose you want to implement a Sudoku game that consists of 9x9 rows and...
- What is the percent yield of the solid product when 17.62 g of iron(III) nitrate reacts...
- Kilgore Natural Gas has $1,000 par value bonds outstanding at 12% interest. The bonds will mature...
- 19.20 grams of barium hydroxide, Ba(OH)2 is dissolved in 178.0 ml of water (you may assume...