Question
In: Economics
2. Consider that China (and to a somewhat lesser extent India) has moved from relative autarky to...
2. Consider that China (and to a somewhat lesser extent India) has moved from relative autarky to relative openness in a short period of time (30 years or so). Suppose both countries are relatively abundant in labor, compared with the rest of the world. The rest of the world is relatively abundant in land. Let there be two tradeable goods: manufacturing, which is labor intensive, and food, which is land-intensive.
a. Use a relative supply - relative demand graph to demonstrate the effect of a movement by China and India from autarky to free trade on the rest of the world's terms of trade (manufacturing relative to food). (10 points)
b. Suppose that the world has two factors (labor and land). Using the Heckscher-Ohlin model, describe the consequences of China and India's entry for the wage paid to labor in the rest of the world. What does the model predict about the impact on wages in China and India? (10 points)
c. Suppose that a country like Mexico was an exporter of labor-intensive manufacturing before China and India began trading, and remained a labor-intensive exporter after China and India began trading. Use the standard trade model to represent the changes in Mexico's production and consumption outcomes as a result of the changes. (20 points).
Solutions
Expert Solution
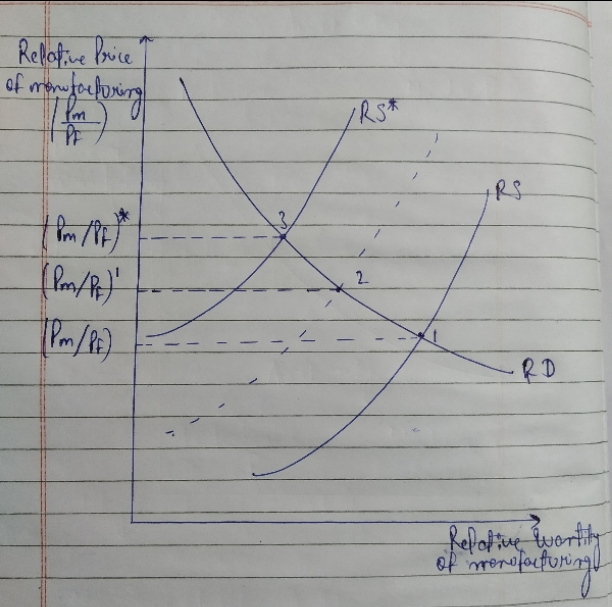
(a) Before India and China opened itself for free trade the relative supply of manufacturing good for rest of the world was RS* and the relative supply curve for India and China was RS and the relative demand was same for everyone. It shows that supply of manufacturing goods were more in India and China since both countries are labor abundant.
The equilibrium is defined by the intersection of RS and RS curve. The equilibrium price for rest of the world was at (Pm/Pf)* And the equilibrium price for the China and India was at (Pm/Pf).
When the China and India opens itself for trade the relative supply for manufacturing goods shifts between the two previous RS curves. Because one China and India opens itself for trade the supply of manufacturing goods reduces in China and India and increase in rest of the world.
Similarly relative price of manufacturing goods in China and India increases and relative price of manufacturing goods falls in rest of the world. The new relative price is now at (Pm/Pf)'.
 (b) According to
heckscher-ohlin model a country that is abundant in a factor
exports the good whose production is intensive in that factor.
(b) According to
heckscher-ohlin model a country that is abundant in a factor
exports the good whose production is intensive in that factor.
Since trade leads to equalization of relative prices in India and China and rest of the world. As we can see in the diagram above, the relative price of manufacturing goods falls in the rest of the world and while in India it increases. It's implication on the wages paid to the labors in rest of the world will be negative as the price of manufacturing goods falls and manufacturing good is labor intensive. So the labors engaged in the production of manufacturing goods in rest of the world's losses from the falling price of manufacturing goods.
And the implication on the wages of labor in India and China will be positive as the price of manufacturing goods increases in India and China. So the labors engaged in the production of manufacturing goods gains from higher prices.
(C) Before India and China entered trade Mexico was producing at point A where iso value line is tangent to PPF and the relative price of manufacturing is( Pm/Pf) and was consuming at point A*, where the price line is tangent to the indifference curve IC . And when India and China starts exporting manufacturing good the relative price of manufacturing falls in rest of the world so does in Mexico. The new relative price is shown by the new price line with slope (Pm/Pf)* This is shown by the flatter relative price line because price of manufacturing goods falls relative to food and Mexico's production is at now point B where iso value line is tangent to PPF. At this point Mexico is now producing less manufacturing good than before and more of food than before. And on this relative price Mexico consumes at point B* that maximizes it's utility. The indifference curve IC* is tangent to the new price line at point B*. As we can see after China and India starts exporting manufacturing good the Mexico's optimum consumption bundle lies below the previous consumption bundle.
This shows that Mexico's welfare got affected negatively by India and China entering trade.

After India and China starts exporting manufacturing goods the optimal consumption bundle for Mexico shifts down at point B* from point A*.
 Rahul Sunny answered 1 month ago
Related Solutions
Compare the economic policies and relative economic performance of China and India.
Ques-1) In a multinational company, 30% of the employees are from CHINA,35% are from INDIA,20% are...
Globalization has pulled hundreds of millions of people out of poverty in China and India and...
Consider that the dollar value of benefits to society from preserving lesser prairie chicken habitat is...
From the perspective of a developing economy (e.g., India, China), do you think globalization is an...
Write first 3 ranked stock exchange from USA and one from Turkey, China, Japon and India....
Choose a civilization from ancient China (Shang; Zhou; Han) and one from India (Harrapan; Aryan; Mauryan)...
Considering the Buddhist art we examined from we examined from India, China, and Japan, what might...
2. Suppose that the small country describe in Q1 moves from autarky to open its economy...
2 Growth Discrepencies Both China and India have averaged around 7% GDP growth rates over the...
- Fogerty Company makes two products—titanium Hubs and Sprockets. Data regarding the two products follow: Direct Labor-Hours...
- 1. Imagine that you want to obtain a loan from a bank for a business that...
- Write a function named int2ordinal that takes an integer as its only parameter and returns the...
- An experiment to measure the value of g is constructed using a tall tower outfitted with...
- Discuss the two estimation methods of classification-type data mining models while considering ANN as a classifier.
- For the equilibrium: CO2(g) + H2(g) ⇌ CO(g) + H2O(g), Kp = 10-5 at 25°C and...
- Sanyu Sony started a new business and completed these transactions during December. Dec. 1 Sanyu Sony...