Question

In: Economics

The United Kingdom has a drinking problem. British per-capita consumption of alcohol rose 19% between 1980...

The United Kingdom has a drinking problem. British per-capita consumption of alcohol rose 19% between 1980 and 2007, compared with a 13% decline in other developed countries. Worried about excessive drinking among young people, the British government increased the tax on beer by 42% between 2008 and 2012. Under what circumstances will this beer tax substantially reduce the market equilibrium quantity of beer? [Hint: answer in terms of both elasticity of demand and elasticity of supply]

Solutions

Expert Solution

When the other things remain stable, the amount of supply shifts reacts because of the changes in the price level and the sum of demand changes are due to changes in price levels.

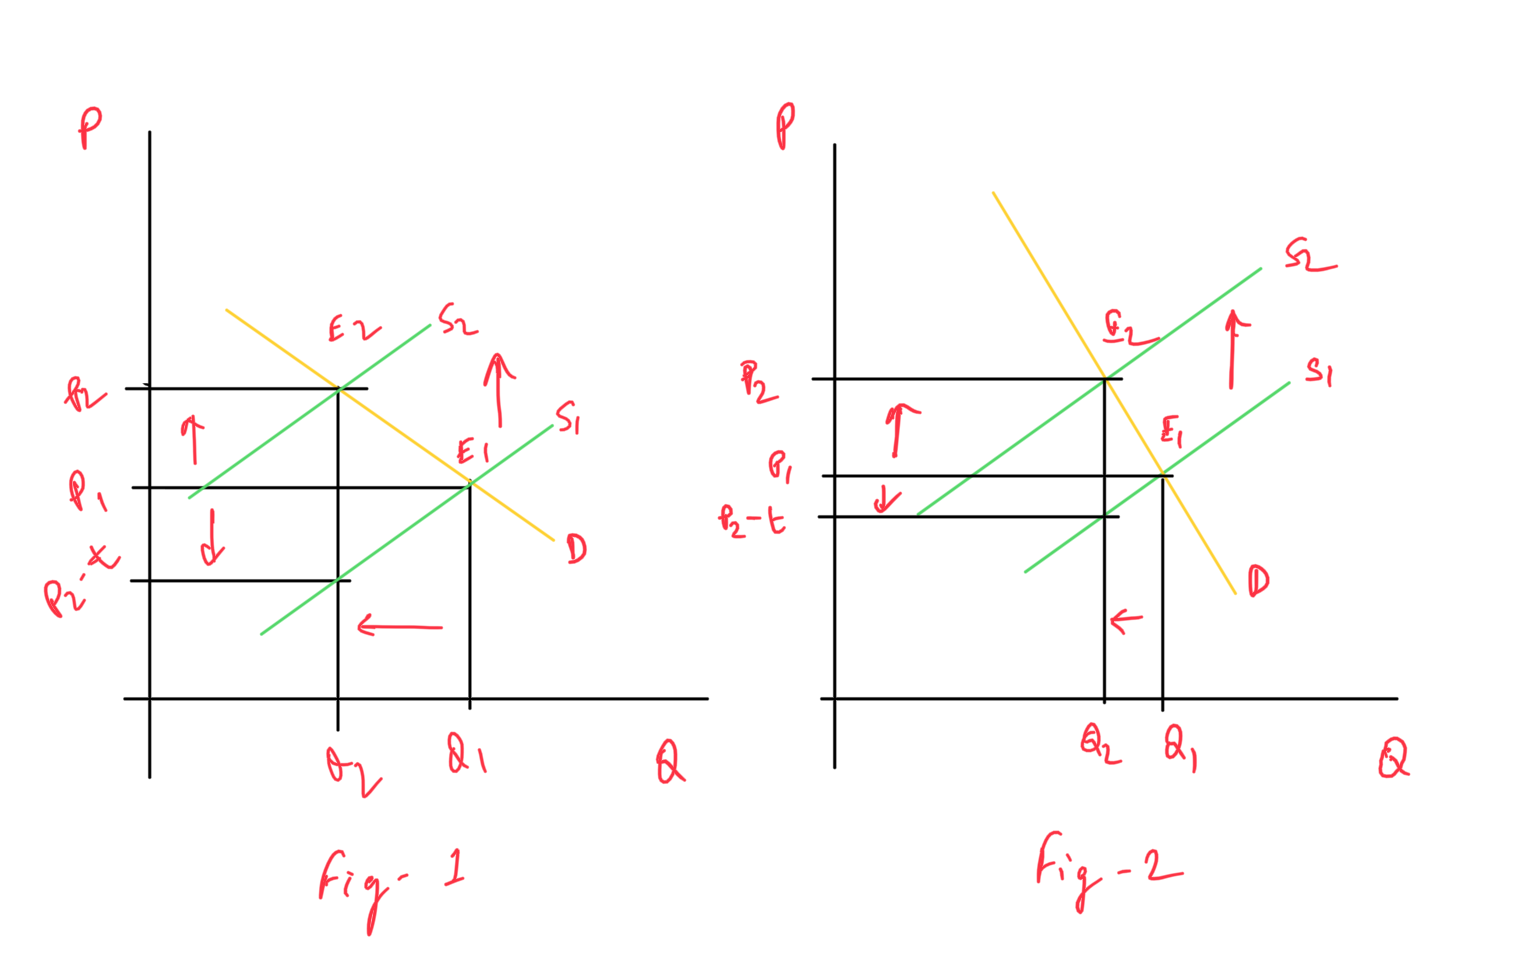
Fig-1 estimates the value of the vertical axis and tests the sum of the horizontal axis. The increase in the tax rate increases the price level as demand is more elastic, meaning that a small price change is causing a significant change in demand for quantities. Therefore, the supply curve changes from S1 to S2 because the tax rate rises caused by a change in price level P1 to P2 and the demand for quantity falls from Q1 to Q2, with a new balance at E2.

Fig-2 shows the effect of a balancing tax, where the price elasticity of the market is greater than 1. Fig-2 includes value calculation of the vertical axis and quantity measurement of the horizontal axis. An rise in the tax rate leads to an increase in prices as demand is inelastic, which means that a large exchange rates increase the demand for goods in a small amount. As such, the supply curve changes from S1 to S2 due to a higher tax level, which induces a change in prices from P1 to P2 and reduces demand for quantities from Q1 to Q2 and a new balance is formed at E2.

Fig-1 shows the effects of the supplier's tax consumed and Fig-2 shows the consumer's cost. Thus the customer lowers the intake of balance quantities of alcohol when the supply curve becomes ideally elastic when the specific tax burden shifts are changed.


Related Solutions

Consider the relationship between yearly wine consumption (liters of alcohol from drinking wine, per person) and...
Consider the relationship between yearly wine consumption (liters of alcohol from drinking wine, per person) and yearly deaths from heart disease (deaths per 100,000 people) in 19 developed countries. Suppose that you read a newspaper article in which the reporter states the following: Researchers find the correlation between yearly wine consumption and yearly deaths from heart disease is -0.84. Thus, it is reasonable to conclude that increased consumption of alcohol from wine causes fewer deaths from heart disease in industrialized...
According to a recent study annual per capita consumption of milk in the United States is...
According to a recent study annual per capita consumption of milk in the United States is 22.6 gallons. Being from the Midwest, you believe milk consumption is higher there and wish to test your hypothesis. A sample of 14 individuals from the Midwestern town of Webster City was selected and then each person's milk consumption was entered into the Microsoft Excel Online file below. Use the data to set up your spreadsheet and test your hypothesis. 25.8 23.84 25.25 21.2...
According to a recent study annual per capita consumption of milk in the United States is...
According to a recent study annual per capita consumption of milk in the United States is 21.5 gallons. Being from the Midwest, you believe milk consumption is higher there and wish to test your hypothesis. A sample of 14 individuals from the Midwestern town of Webster City was selected and then each person's milk consumption was entered into the Microsoft Excel Online file below. Use the data to set up your spreadsheet and test your hypothesis. Given Data: Gallons of...
According to a recent study annual per capita consumption of milk in the United States is...
According to a recent study annual per capita consumption of milk in the United States is 21.5 gallons. Being from the Midwest, you believe milk consumption is higher there and wish to test your hypothesis. A sample of 14 individuals from the Midwestern town of Webster City was selected and then each person's milk consumption was entered into the Microsoft Excel Online file below. Use the data to set up your spreadsheet and test your hypothesis. 24.8 23.84 25.25 21.3...
According to a recent study annual per capita consumption of milk in the United States is...
According to a recent study annual per capita consumption of milk in the United States is 21.5 gallons. Being from the Midwest, you believe milk consumption is higher there and wish to test your hypothesis. A sample of 14 individuals from the Midwestern town of Webster City was selected and then each person's milk consumption below. Gallons of Milk 27.1 23.84 25.25 21 17.52 19.61 19.83 26.18 34.97 29.9 28.59 20.57 26.94 27.24 Develop a hypothesis test that can be...
The annual per capita consumption of fresh bananas​ (in pounds) in the United States can be...
The annual per capita consumption of fresh bananas​ (in pounds) in the United States can be approximiated by the normal​ distribution, with a mean of 8.4 pounds and a standard deviation of 4 pounds. Answer the following questions about the specified normal distribution.​ (a) What is the smallest annual per capita consumption of bananas that can be in the top 10​% of​ consumptions?​ (b) What is the largest annual per capita consumption of bananas that can be in the bottom...
According to a recent study annual per capita consumption of milk in the United States is...
According to a recent study annual per capita consumption of milk in the United States is 21.5 gallons. Being from the Midwest, you believe milk consumption is higher there and wish to test your hypothesis. A sample of 14 individuals from the Midwestern town of Webster City was selected and then each person's milk consumption was entered into the Microsoft Excel Online file below. Use the data to set up your spreadsheet and test your hypothesis. Gallons of Milk 29.8...
According to a recent study annual per capita consumption of milk in the United States is...
According to a recent study annual per capita consumption of milk in the United States is 23.8 gallons. Being from the Midwest, you believe milk consumption is higher there and wish to test your hypothesis. A sample of 14 individuals from the Midwestern town of Webster City was selected and then each person's milk consumption was entered into the Microsoft Excel Online file below. Use the data to set up your spreadsheet and test your hypothesis. Gallons of Milk 28.9...
According to a recent study annual per capita consumption of milk in the United States is...
According to a recent study annual per capita consumption of milk in the United States is 22.6 gallons. Being from the Midwest, you believe milk consumption is higher there and wish to test your hypothesis. A sample of 14 individuals from the Midwestern town of Webster City was selected and then each person's milk consumption was entered into the Microsoft Excel Online file below. Use the data to set up your spreadsheet and test your hypothesis. Gallons of Milk 28.3...
The annual per capita (average per person) chewing gum consumption in the United States is 200...
The annual per capita (average per person) chewing gum consumption in the United States is 200 pieces. Suppose that the standard deviation of per capita consumption of chewing gum is 145 pieces per year. (a) Find the probability that the average annual chewing gum consumption of 84 randomly selected Americans is more than 220 pieces. (b) Find the probability that the average annual chewing gum consumption of 84 randomly selected Americans is within 100 pieces of the population mean. (c)...
ADVERTISEMENT
ADVERTISEMENT
ADVERTISEMENT