Question
In: Math
3-The following data were collected in a survey of 8th graders and summarize their cell phone...
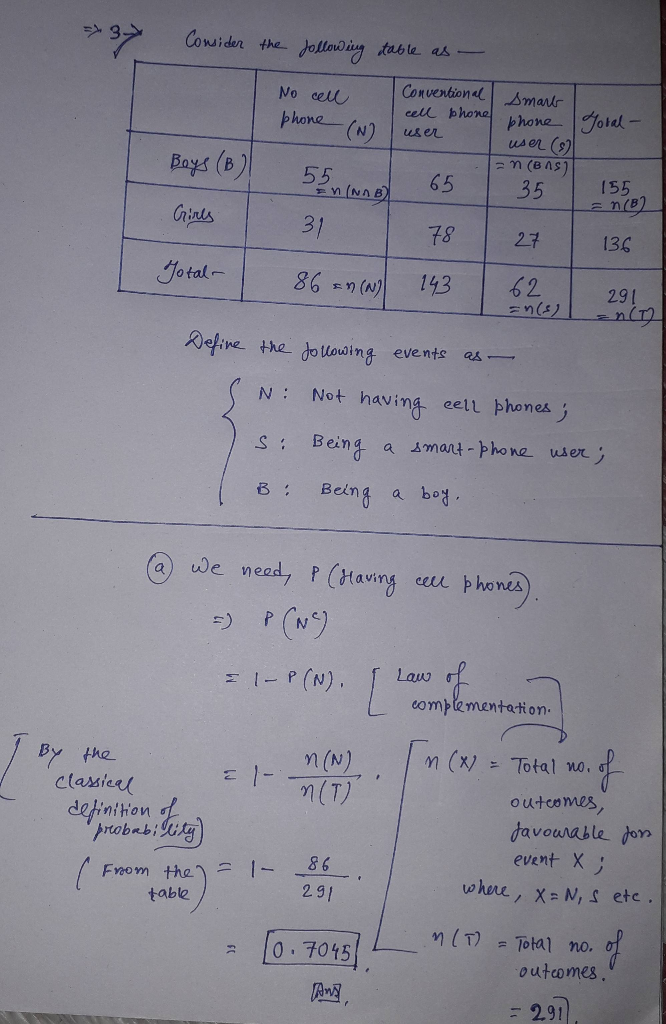
3-The following data were collected in a survey of 8th graders and summarize their cell phone status.
|
No cell phone |
Conventional cell phone user |
Smart phone user |
|
|
Boys |
55 |
65 |
35 |
|
Girls |
31 |
78 |
27 |
a) What proportion of the 8th graders have cell phones?
b) What proportion of the boys do not have cell phones?
c) What proportion of smart phone users are boys?
Solutions
Expert Solution
TOPIC:Conditional law and Classical definition of probability.

 milcah answered 3 months ago
Related Solutions
Using the data in the Excel file Cell Phone Survey, determine if the mean response for...
Using the data in the Excel file Cell Phone Survey, determine if
the mean response for Customer Service rating is different for the
carriers (consider only AT&T, Verizon, and Sprint) for
significance level of 5%.
Gender Carrier Type
Usage Signal strength Value for the
Dollar Customer Service
M AT&T Smart
High 5 4 4
M AT&T Smart
High 5 4 2
M AT&T Smart
Average 4 4 4
M AT&T Smart Very
high 2 3 3
M AT&T Smart Very...
A research report indicated that in 2018, 59% of all 6th graders owned a cell phone....
A research report indicated that in 2018, 59% of all
6th graders owned a cell phone. A random sample of 151
6th graders is drawn.
Is it appropriate to use the normal approximation for this
situation? Why or why not?
Find the probability that the sample proportion of
6th graders who own a cell phone is more than 64.5%.
(Find P(p > 0.645)).
Calculate the probability that the sample proportion of
6th graders who own a cell phone is between...
The following data were collected from a survey of 10 randomly selected college students: Find the...
The following data were collected from a survey of 10 randomly
selected college students:
Find the mean, median, mode, variance, standard deviation, the
five number summary report of the hours per week of the sample of
students’ studied. Show your work.
Student ID
Facebook
# hours of study per week
244701130
Yes
8
302896051
no
5
734077249
yes
11
891072704
yes
5
730265917
yes
9
894866913
no
6
644678646
no
1
369417477
yes
1
388511718
yes
2
554470987
no
1
Why are cell phone data plans cheaper in Europe? Why might cell phone data plans have...
Why are cell phone data plans cheaper in Europe? Why might cell
phone data plans have different prices across markets?
In a large survey, third graders were asked what their favorite color is. The results are...
In a large survey, third graders were asked what their favorite
color is. The results are in the table below.
Color
Red
Blue
Yellow
Pink
Green
Orange
Relative
Frequency
14%
25%
18%
20%
13%
10%
Suppose that 10 randomly selected students are chose. What is
the probability that 3 students say blue is their favorite
color?
In the Cell Phone Survey below, test the hypothesis that the mean responses for Value for...
In the Cell Phone Survey below, test the hypothesis that the
mean responses for Value for the Dollar and Customer Service do not
differ by gender.
Gender
Carrier
Type
Usage
Signal strength
Value for the Dollar
Customer Service
M
AT&T
Smart
High
5
4
4
M
AT&T
Smart
High
5
4
2
M
AT&T
Smart
Average
4
4
4
M
AT&T
Smart
Very high
2
3
3
M
AT&T
Smart
Very high
5
5
2
M
AT&T
Smart
Very high...
You have collected information on the brand of cell phone owned by 100 students. Which of...
You have collected information on the brand of cell phone owned
by 100 students. Which of the following visualizations should not
be used on this type of data?
Histogram
Bar chart
Pie chart
Stacked column chart
I have collected data and for one of my variables, the mean is
100, the median is 90 and the mode is 80. What shape is the
distribution of this variable?
Symmetric
Right skewed
Left skewed
You have recorded the level of traffic on...
In the study of cell phone use and brain hemispheric dominance, an internet survey was emailed...
In the study of cell phone use and brain hemispheric dominance,
an internet survey was emailed to 2524 subjects randomly selected
from an online group involved with ears. 930 surveys were returned.
Construct a 99% confidence interval for the proportion of returned
surveys.
A. Find the best point estimate of the population proportion
p
B. Identify the value of the margin of error E.
C. Construct the confidence interval
In a study of cell phone use and brain hemispheric dominance, an internet survey was emailed...
In a study of cell phone use and brain hemispheric dominance, an
internet survey was emailed to 2601 subjects randomly selected from
an online group involved with ears. 975 surveys were returned.
Construct a 90% confidence interval for the proportion of returned
surveys. a) What is the best point estimate of the population P c)
Construct the confidence level b) Identify the value of the margin
of error E. c) Construct the confidence level.
in a study of cell phone use and brakn hemispheric dominance, an internet survey was emailed...
in
a study of cell phone use and brakn hemispheric dominance, an
internet survey was emailed to 2319 subjects randomly selected from
an online group involved with ears. 1022 surveys were returned.
construct a 95% confidence interval for the proportion of returned
surveys
A. find the best point estimate of the populatiom proportion
p
B. identify the value of the margin of error E
C. construct the confidence interval
ADVERTISEMENT
ADVERTISEMENT
Latest Questions
- Why is Tukey's method more powerful than Bonferroni's method?
- Why did the course of World War I turn out to be so different from what...
- A rural 6-lane divided highway with AADT = 30,000 veh/ day, with composition [(80% PC –...
- *VISUAL BASIC* Construct and instantiate an array of strings called afcSouth that contains the following information...
- LAG network inc. balance sheet and income statement are as follows: LAG network inc. income statement...
- Calculate the pH at the equivalence point in titrating 0.110 M solutions of each of the...
- why joints differ in their degree of mobility.
ADVERTISEMENT