Question
In: Math
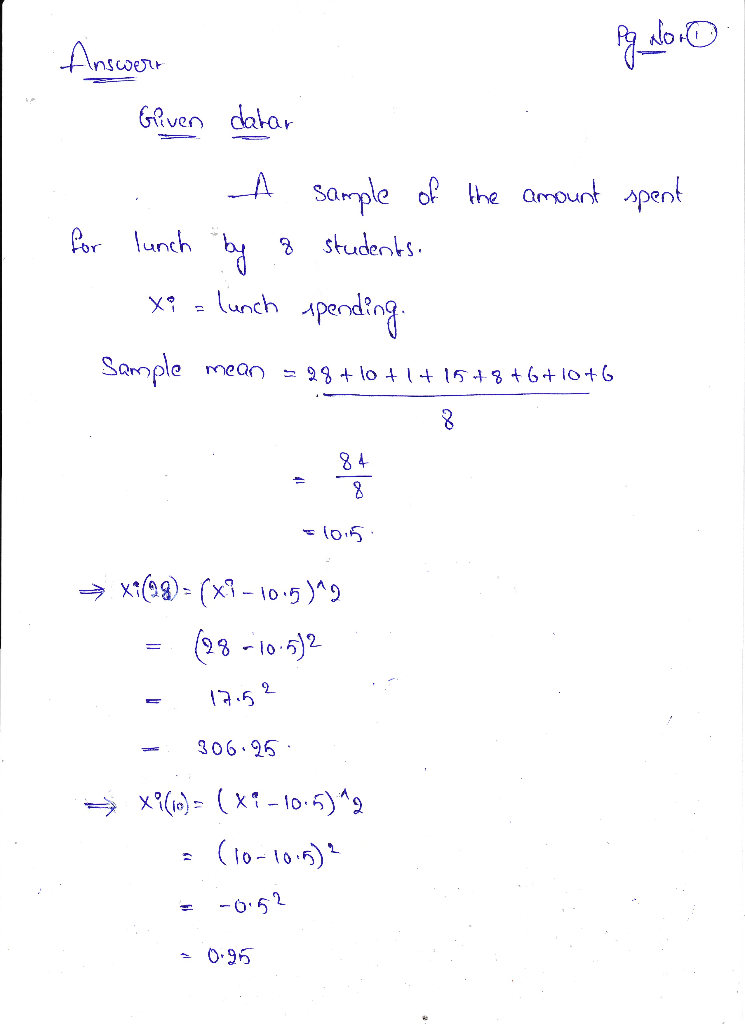
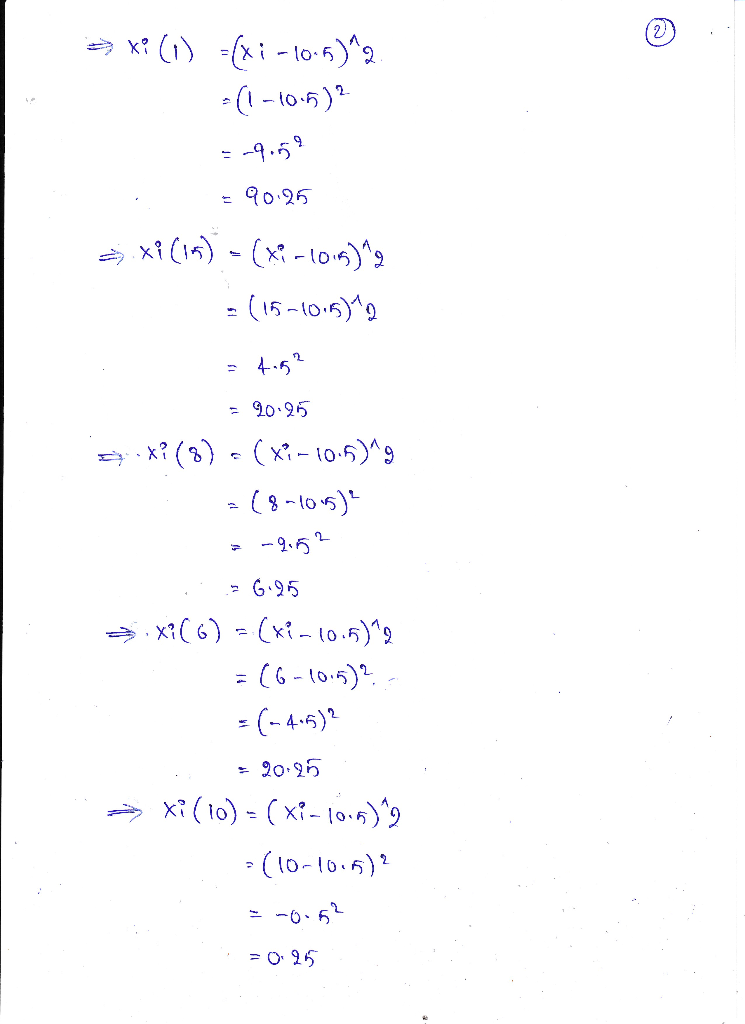
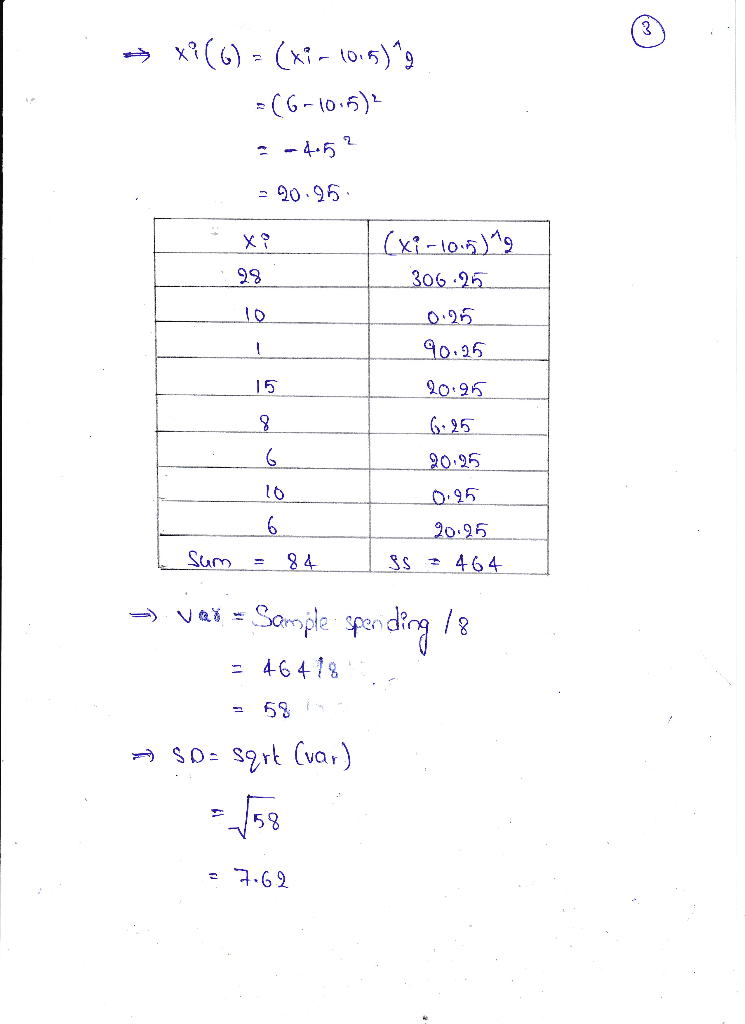
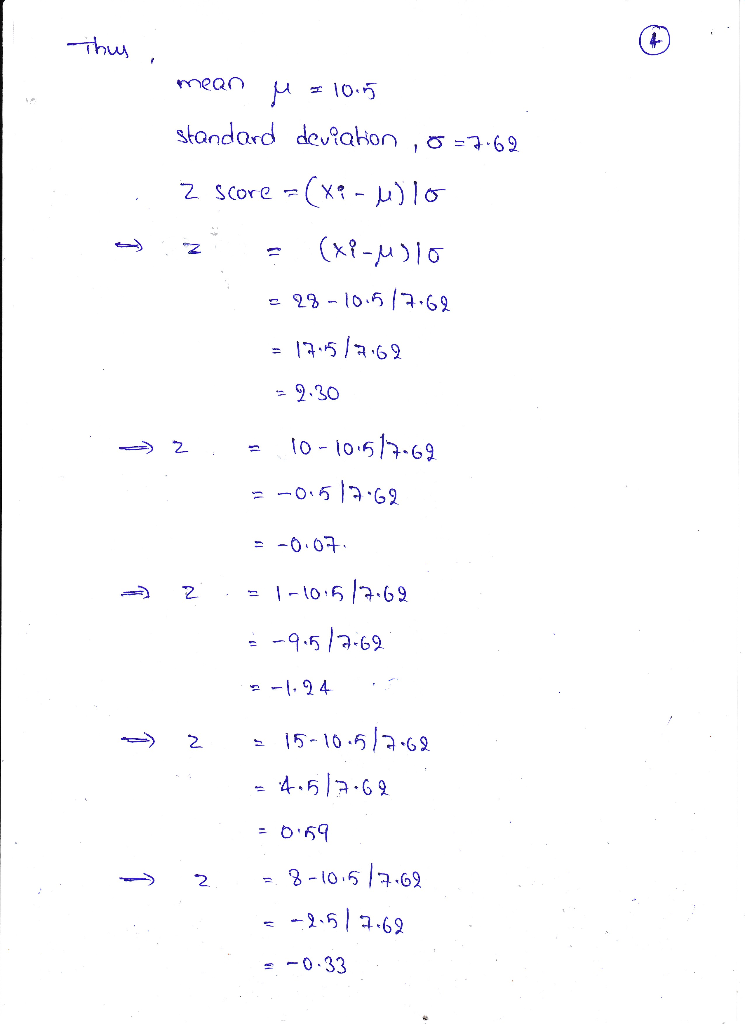
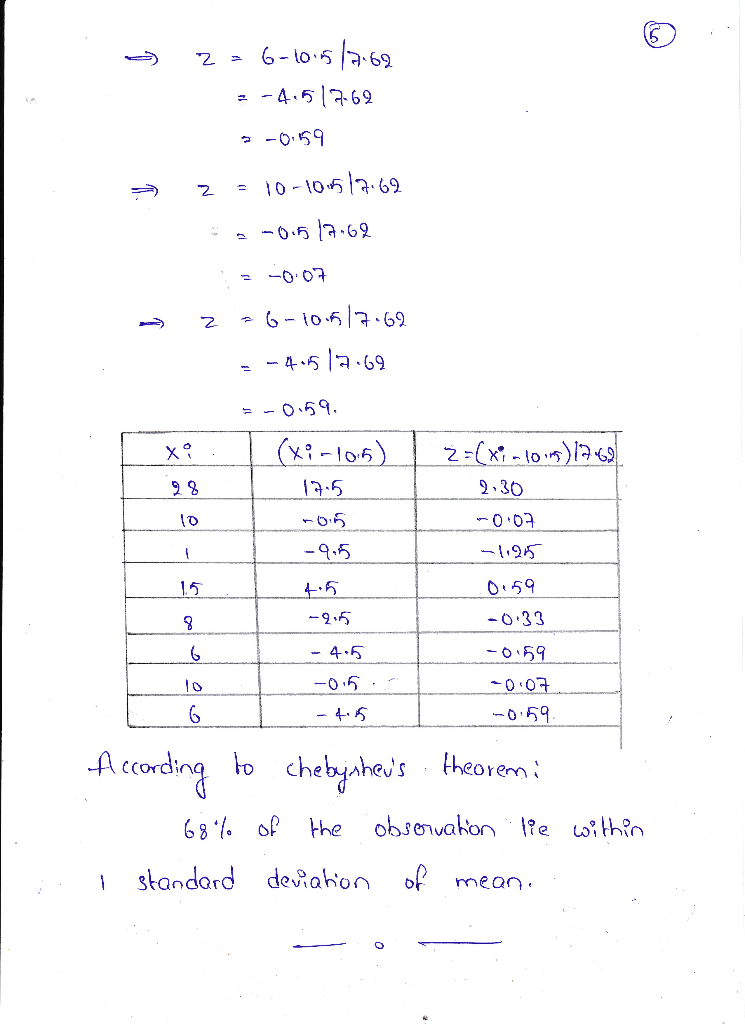
Lunch Spending ($) = xi z-scores 28 10 1 15 8 6 10 6 Calculate the...
|
Lunch Spending ($) = xi |
z-scores |
||||
|
28 |
|||||
|
10 |
|||||
|
1 |
|||||
|
15 |
|||||
|
8 |
|||||
|
6 |
|||||
|
10 |
|||||
|
6 |
|||||
- Calculate the z-scores (to two decimal places) for each observation and write the answers in the last column on the table above.
- According to Chebyshev’s Theorem, what percentage of the observations should be within 1 standard deviations of the mean? (Hint: be sure to word your answer correctly.) For this question, you do not need to use any data—this is a purely theoretical question asking what Chebyshev predicts for this situation.
Solutions
 milcah answered 3 months ago
Related Solutions
Let Xi = lunch condition on day i (rice/noodles) P(Xi+1 = rice| Xi-1 = rice, Xi...
Let Xi = lunch condition on day i (rice/noodles)
P(Xi+1 = rice| Xi-1 = rice, Xi = rice)
= 0.7
P(Xi+1 = rice| Xi-1 = noodles, Xi =
rice) = 0.6
P(Xi+1 = rice| Xi-1 = rice, Xi =
noodles) = 0.3
P(Xi+1 = rice| Xi-1 = noodles, Xi =
noodles) = 0.55
Q1. Is {Xn} a Markov Chains? Why?
Q2. How to transform the process into
a M.C. ?
Calculate raw scores from the following z-scores. The mean of the original dataset was 10, and...
Calculate raw scores from the following z-scores. The mean of
the original dataset was 10, and the standard deviation was 3.
1. What is the raw score for a z-score of -2.89?
2. What is the raw score for a z-score of +0.74?
3. What is the raw score for a z-score of +1.18?
4. What is the raw score for a z-score of -0.94?
5. What is the raw score for a z-score of -1.26?
Consider the data. xi 2 6 9 13 20 yi 7 17 10 28 24 (a)...
Consider the data.
xi
2
6
9
13
20
yi
7
17
10
28
24
(a)
What is the value of the standard error of the estimate? (Round
your answer to three decimal places.)
_________
(b)
Test for a significant relationship by using the t
test. Use α = 0.05.
State the null and alternative hypotheses.
H0: β0 = 0
Ha: β0 ≠ 0
H0: β1 = 0
Ha: β1 ≠
0
H0: β0 ≠ 0
Ha: β0 = 0...
Consider the data. xi 2 6 9 13 20 yi 8 17 11 28 23 (a)What...
Consider the data.
xi
2
6
9
13
20
yi
8
17
11
28
23
(a)What is the value of the standard error of the estimate?
(Round your answer to three decimal places.)
(b)Test for a significant relationship by using the t
test. Use α = 0.05. State the null and alternative hypotheses.
(b.1)Find the value of the test statistic. (Round your answer to
three decimal places.)
(b.2)Find the p-value. (Round your answer to four
decimal places.)
(c)State your conclusion...
4. Convert the following x-scores to z-scores: a) 8 &nbs
4. Convert the following x-scores to z-scores:
a)
8
b) 21.5
5. Convert the following z-scores to x-scores:
a) .2667
6.Find the area under the curve:
a) to the left of z =
1.15
b) to the left of z = -0.24
c) to the right of z =
1.06
d) between z = 1.25 and z = -1.
7.A survey indicates that people use their
computers an average of 2.4 years before upgrading...
15, What z-score value separates the highest 10% of the scores in a normal distribution from...
What z-score value separates the highest 10% of the scores in a normal distribution from the lowest 90%?
a. z=1.28
d. z=0.25
c. z=-1.28
d. z=-0.25
Consider the data. xi 3 12 6 20 14 yi 55 35 45 10 15 The...
Consider the data.
xi
3
12
6
20
14
yi
55
35
45
10
15
The estimated regression equation for these data is ŷ =
62.25 − 2.75x.
(a) Compute SSE, SST, and SSR using equations SSE =
Σ(yi −
ŷi)2, SST =
Σ(yi −
y)2, and SSR =
Σ(ŷi −
y)2.
SSE=
SST=
SSR=
(b) Compute the coefficient of determination
r2.(Round your answer to three decimal
places.)
r2 =
Comment on the goodness of fit. (For purposes of this...
2 10 6 10 10 4 5 4 5 8 a) Calculate the range. b) Calculate...
2 10 6 10 10 4 5 4 5 8
a) Calculate the range.
b) Calculate the variance.
(Round to two decimal places as needed.)
c) Calculate the standard deviation.
(Round to two decimal places as needed.)
13 28 30 17 24 9 44 21
a)Determine the 20th percentile.
b)Determine the 30th percentile.
c)Determine the 70th percentile.
Calculate the z scores, then use the z table. please show work and explain Based on...
Calculate the z scores, then use the z table. please show work
and explain Based on the Normal model N (100, 16) describing IQ
scores from Exercise 24, what percent of applicants would you
expect to have scores a) over 80? b) under 90? c) between 112 and
132? d) over 125?
Calculate the z scores based on the probabilities, then back out
the x values. please show work and explain Based on the model
N(0.062, 0.018) for quarterly returns...
For the Following data: 5, 15, 18, 10, 8, 12, 16, 10, and 6 Find: a)...
For the Following data: 5, 15, 18, 10, 8, 12, 16, 10, and 6
Find:
a) Q1 = 25%; Q2= 50%; Q3 = 75%. Quartile and IQR= Inter Quartile
Range
b) Box Plot Figure with Upper & Lower Limit, Whiskers and
Outlier(s) if any
PLEASE SHOW DETAIL OF YOUR SET UP, FORMULA, CALCULATION.
PLEASE NO EXCEL! Thank you!
ADVERTISEMENT
ADVERTISEMENT
Latest Questions
- Students performed a procedure similar to Part III of this experiment (Analyzing a Vitamin Supplement for...
- The output of the function is a dictionary whose keys represent the bins and whose values...
- The shape of a graph of a binomial distribution depends on the value of both n...
- In 2012, cost per Medicare beneficiary did what?
- 3. A. What techniques can a firm use to optimize demand deposit holdings? B. How do...
- The half-life of mercury-197 is 64.1 hours. If a patient undergoing a kidney scan is given...
- Double bonds react with Br2 to form a dibromide. Isobutylene undergoes cationic polymerization under conditions where...
ADVERTISEMENT