Question
In: Math
Two manufacturing processes are being compared to try to reduce the number of defective products made....
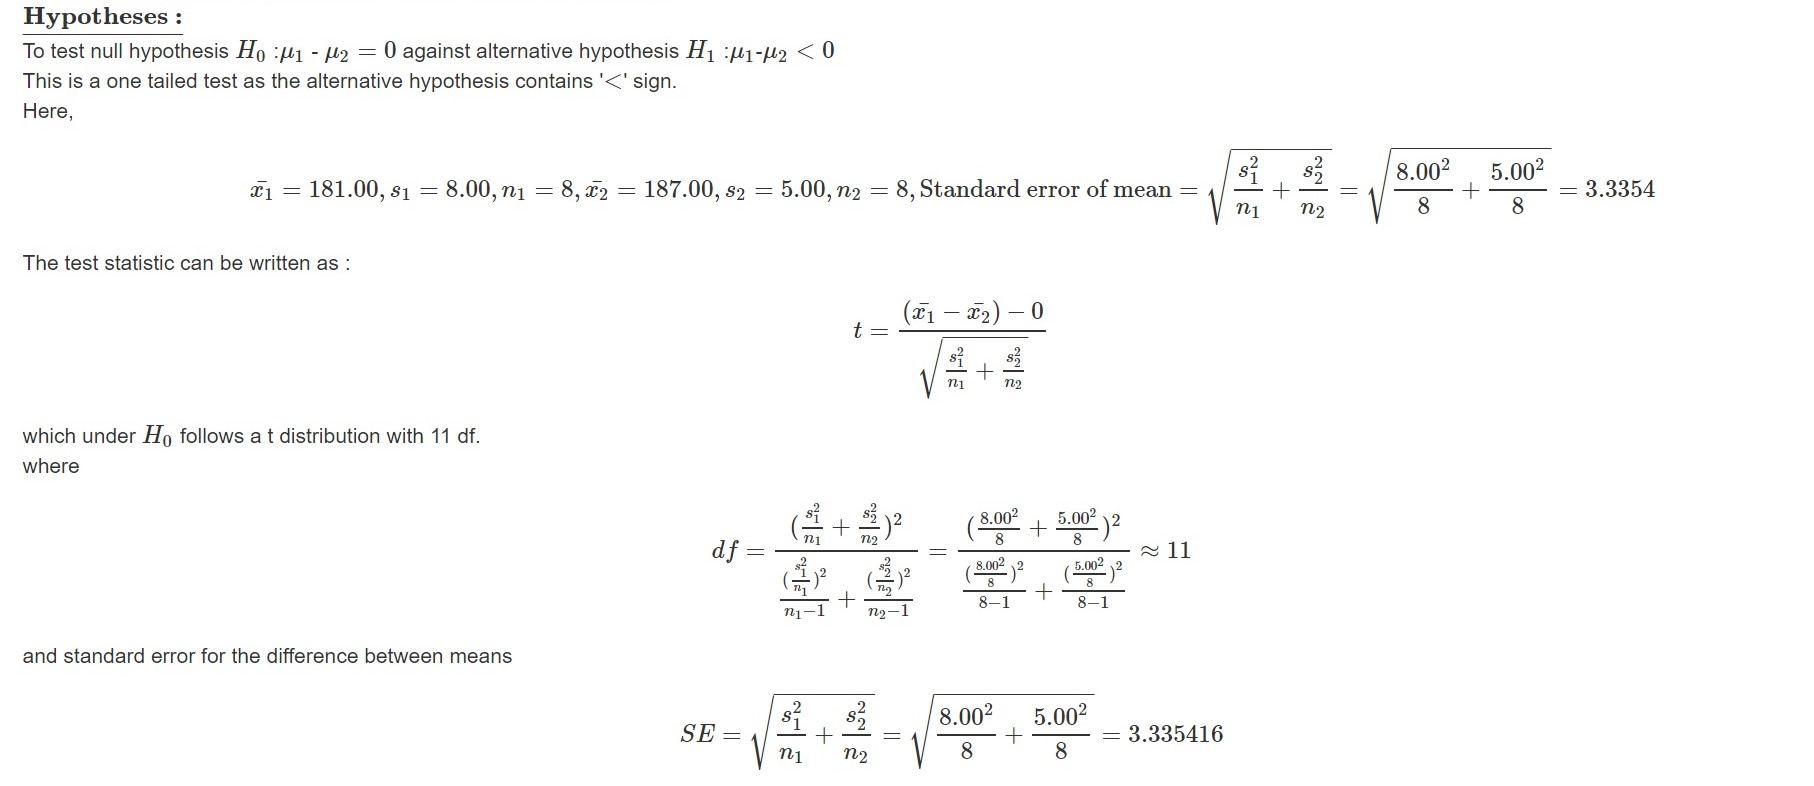
Two manufacturing processes are being compared to try to reduce the number of defective products made. During 8 shifts for each process, the following results were observed:
| Line A | Line B | |
| n | 8 | 8 |
| x-bar | 181 | 187 |
| s | 8 | 5 |
Based on a 5% significance level, did line B have a larger average than line A?
*Do not use the p-value method
*Use the five step method
Step 1: H0 :
HA:
Step 2: alpha =
Step 3: Test Statistic:
Step 4: Decision Rule:
Step 5: Calculation and Decision
Reject or do not reject H0? Why?
Based on a 5% significance level, did line B have better performance than line A in terms of process variation?
*Do not use the p-value method
*Use and show the five step method, as shown above
Reject or do not reject the H0? Why?
Solutions
Expert Solution
Let  denite the average number of defective products made by Line A and
Line B respectively.
denite the average number of defective products made by Line A and
Line B respectively.
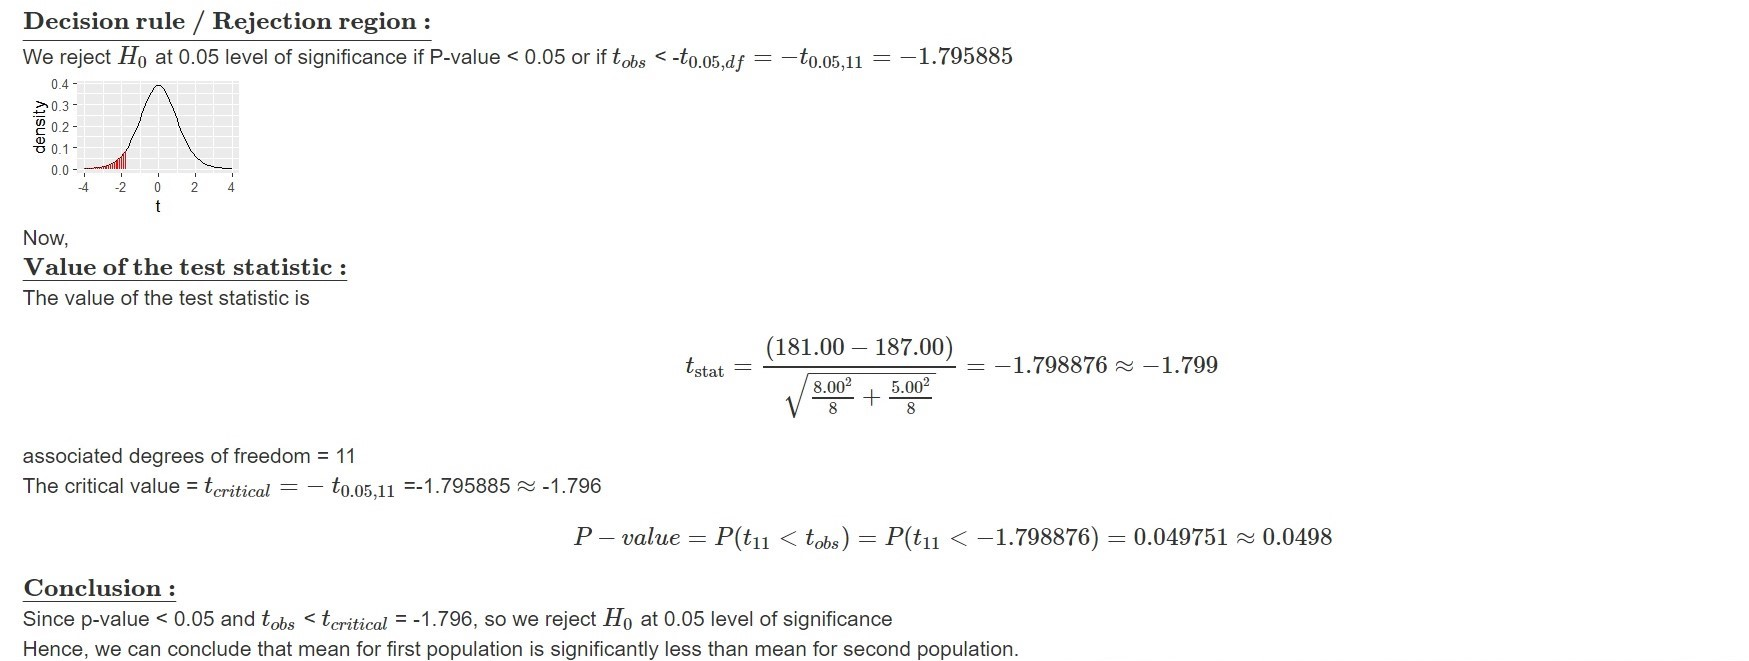
Conclusion in context of problem :
There is enough evidence to support the claim that line B have a significantly larger average than line A.
 milcah answered 4 months ago
Related Solutions
Number of defective monitors manufactured in day shift and afternoon shift is to be compared. A...
Number of defective monitors manufactured in day shift and afternoon shift is to be compared. A...
The number of defective items in a manufacturing process is an example of _________ data. a...
Two kinds of thread are being compared for strength.
The proportions of defective parts produced by two machines were compared, and the following data were...
1A) The proportions of defective parts produced by two machines were compared, and the following data...
Suppose it is management's goal to reduce the number of employee grievances being filed in a...
Suppose it is management's goal to reduce the number of employee grievances being filed in a...
Two semiconductor factories are being compared to see if there is a difference in the average...
1, Standardization of products and manufacturing processes across markets is a strategy that : A, Increased...
- Write a memo by answering following questions. Overview: Identify a current topic impacting financial statements or...
- Based on what you learned in this module, identify one person who you believe possesses primarily...
- An Auditor may decide to make use of a specialist in obtaining sufficient appropriate audit evidence...
- Dirac's Theorem states that "A simple graph with n vertices (n >= 3) is Hamiltonian if...
- Two 10-cm-diameter charged rings face each other, 15cm apart. The left ring is charged to -29nC...
- Under what conditions would it be possible for an excise tax to have no efficiency cost...
- explain the difference between activities and financial statements of service businesses and merchandising businesses.