Question
In: Math
Consider the following sample data. Sample A: 10, 17, 24 Sample B: 68, 75, 82 Sample...
Consider the following sample data.
| Sample A: | 10, 17, 24 |
| Sample B: | 68, 75, 82 |
| Sample C: | 1,035; 1,042; 1,049 |
(a) Find the mean and standard deviation for each
sample.
| Sample A: | Sample B: | Sample C: | |
| Mean | |||
| Sample Standard Deviation | |||
(b) What does this exercise show about the
standard deviation?
____The idea is to illustrate that the standard deviation is not a function of the value of the mean.
____The idea is to illustrate that the standard deviation is a function of the value of the mean.
Solutions
Expert Solution
GIVEN:
| Sample A | 10, 17, 24 |
| Sample B | 68, 75, 82 |
| Sample C | 1035, 1042, 1049 |
SOLUTION:
MEAN AND STANDARD DEVIATION OF SAMPLE A:
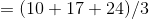
The mean for sample A is given by,


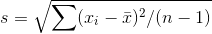
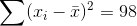
The standard deviation for sample A is given by,
 |
 |
 |
| 10 | -7 | 49 |
| 17 | 0 | 0 |
| 24 | 7 | 49 |
 |


The mean for sample A is
 .
.
The standard deviation for
sample A is  .
.
MEAN AND STANDARD DEVIATION OF SAMPLE B:
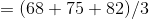
The mean for sample B is given by,

The standard deviation for sample B is given by,
|
|
|
| 68 | -7 | 49 |
| 75 | 0 | 0 |
| 82 | 7 | 49 |
|
The mean for sample B is
 .
.
The standard deviation for
sample B is
.
MEAN AND STANDARD DEVIATION OF SAMPLE C:
The mean for sample C is given by,


The standard deviation for sample C is given by,
|
|
|
| 1035 | -7 | 49 |
| 1042 | 0 | 0 |
| 1049 | 7 | 49 |
|
The mean for sample C is
 .
.
The standard deviation for
sample C is
.
(b) What does this exercise show about the standard deviation?
Standard deviation measures the spread or dispersion of a data distribution. The variability of data points around the mean is same for all three samples given. The idea is to illustrate that the standard deviation is a function of the value of the mean.
 milcah answered 5 months ago
Related Solutions
Consider the following sample. 17, 7, 25, 20, 10, 18 (a) Find the range. (b) Find...
Consider the following set of data. (18, 15), (31, 55), (63, 27), (82, 24), (109, 58),...
Consider the data. xi 2 6 9 13 20 yi 7 17 10 28 24 (a)...
For the following data 86 84 91 75 78 80 74 75 87 76 82 90...
A sample of size 82 will be drawn from a population with mean 24 and standard...
Consider a sample with data values of 27, 24, 22, 15, 31, 33, 28, and 24....
Consider a sample with data values of 27, 24, 22, 16, 30, 35, 29, and 24....
Consider a sample with data values of 26, 24, 23, 18, 31, 35, 29, and 24....
Consider the following sample data. Sample A: 14, 16, 18 Sample B: 72, 74, 76 Sample...
Consider the following sample data. Sample A: 4, 6, 8 Sample B: 63, 65, 67 Sample...
- Dirac's Theorem states that "A simple graph with n vertices (n >= 3) is Hamiltonian if...
- Two 10-cm-diameter charged rings face each other, 15cm apart. The left ring is charged to -29nC...
- Under what conditions would it be possible for an excise tax to have no efficiency cost...
- explain the difference between activities and financial statements of service businesses and merchandising businesses.
- 2. Compare and compare the matrix multiplication algorithm and the Floyd-Warshall algorithm to find all pairs...
- Q: 50.00 ml of 0.5216 M copper(II) nitrate solution is combined with 100.0 ml of 0.5580...
- This is a business law question. Explain how environmental laws regulate the use of toxic substances...