Question
In: Math
A clinic developed a diet to impact body mass (fat and muscle). A nutritionist in the...
A clinic developed a diet to impact body mass (fat and muscle).
A nutritionist in the clinic hypothesizes that heavier individuals
on the diet will predict more body fat. Below are the data for a
sample of clients from the clinic. Weight is measured in kilograms
(kg) and percentage body fat is estimated through skinfold
measurement. What can the nutritionist conclude with α =
0.01?
| Weight | Fat |
|---|---|
| 67 68 94 101 67 81 74 78 60 89 90 |
29 28 25 24 30 26 30 26 31 24 30 |
a.) Compute the statistic selected:
b.) Compute the appropriate test statistic(s) to make a decision
about H0.
(Hint: Make sure to write down the null and alternative hypotheses
to help solve the problem.)
Critical value =
Make an interpretation based on the results.
More weight of individuals on the diet significantly predicts more body fat.
The weight of individuals on the diet does not significantly predict body fat.
Solutions
Expert Solution
Here we need to find the relationship between weight and fat so correlation coefficient should be used.
Following table shows the calculations:
| X | Y | X^2 | Y^2 | XY | |
| 67 | 29 | 4489 | 841 | 1943 | |
| 68 | 28 | 4624 | 784 | 1904 | |
| 94 | 25 | 8836 | 625 | 2350 | |
| 101 | 24 | 10201 | 576 | 2424 | |
| 67 | 30 | 4489 | 900 | 2010 | |
| 81 | 26 | 6561 | 676 | 2106 | |
| 74 | 30 | 5476 | 900 | 2220 | |
| 78 | 26 | 6084 | 676 | 2028 | |
| 60 | 31 | 3600 | 961 | 1860 | |
| 89 | 24 | 7921 | 576 | 2136 | |
| 90 | 30 | 8100 | 900 | 2700 | |
| Total | 869 | 303 | 70381 | 8415 | 23681 |
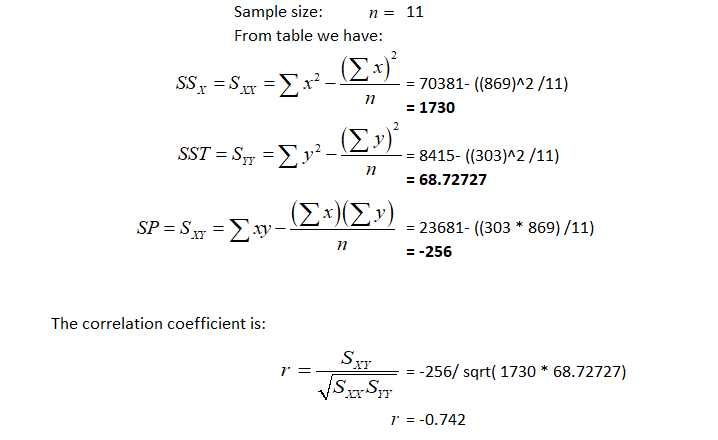
The statistics is: r = -0.742
------------------------------------------------
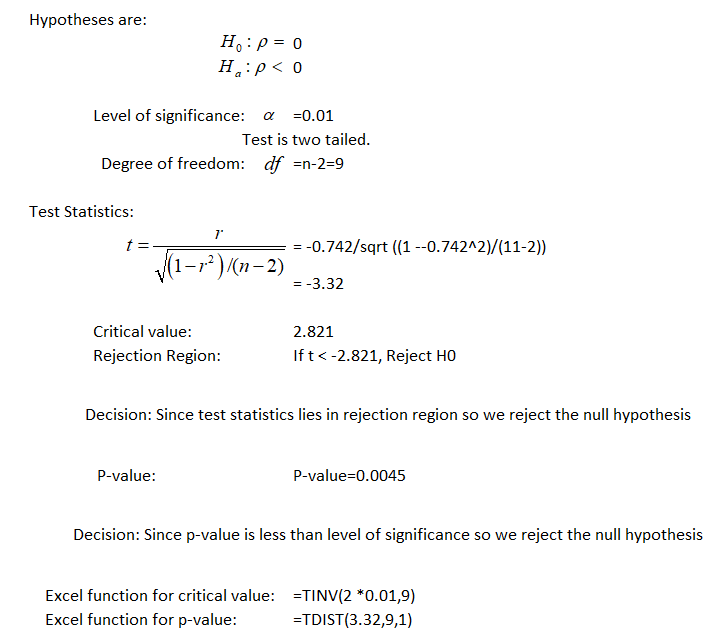
Conclusion: More weight of individuals on the diet significantly predicts more body fat.
 milcah answered 4 months ago
Related Solutions
A clinic developed a diet to impact body mass (fat and muscle). A nutritionist in the...
Application Exercise: A nutritionist is interested in the relationship between cholesterol and diet. The nutritionist developed...
A nutritionist is interested in the relationship between cholesterol and diet. The nutritionist developed a non-vegetarian...
A nutritionist is interested in the relationship between cholesterol and diet. The nutritionist developed a non-vegetarian...
In order to calculate lean and fat mass, you must multiply the body fat percentage by...
Body fat and lean body mass can be estimated in living animals by measuring the total...
Body mass index (BMI) is a reliable indicator of body fat for most children and teens....
Severe dieting results in both the reduction of fat stores and the loss of muscle mass....
A pharmaceutical company developed a new revolutionary diet pill, “fat buster,” which is believed to greatly...
A deficiency of the trace element selenium in the diet can negatively impact growth, immunity, muscle...
- In 2012, cost per Medicare beneficiary did what?
- 3. A. What techniques can a firm use to optimize demand deposit holdings? B. How do...
- The half-life of mercury-197 is 64.1 hours. If a patient undergoing a kidney scan is given...
- Double bonds react with Br2 to form a dibromide. Isobutylene undergoes cationic polymerization under conditions where...
- 1. Which sex chromosomes are limited to only one sex? A. X and Z B. X...
- prepare a tecnical report that discuss about "A custom Union (CU) constitute a partial movement towards...
- in your own opinion, It has been said that a smartphone is a computer in your...