Question
In: Economics
ntity combination listed in the following table. What relationship have you depicted? 3) Use an elasticity...
ntity combination listed in the following table.
What
relationship have you depicted?
3)
Use an elasticity concept to explain each of the
following observations:
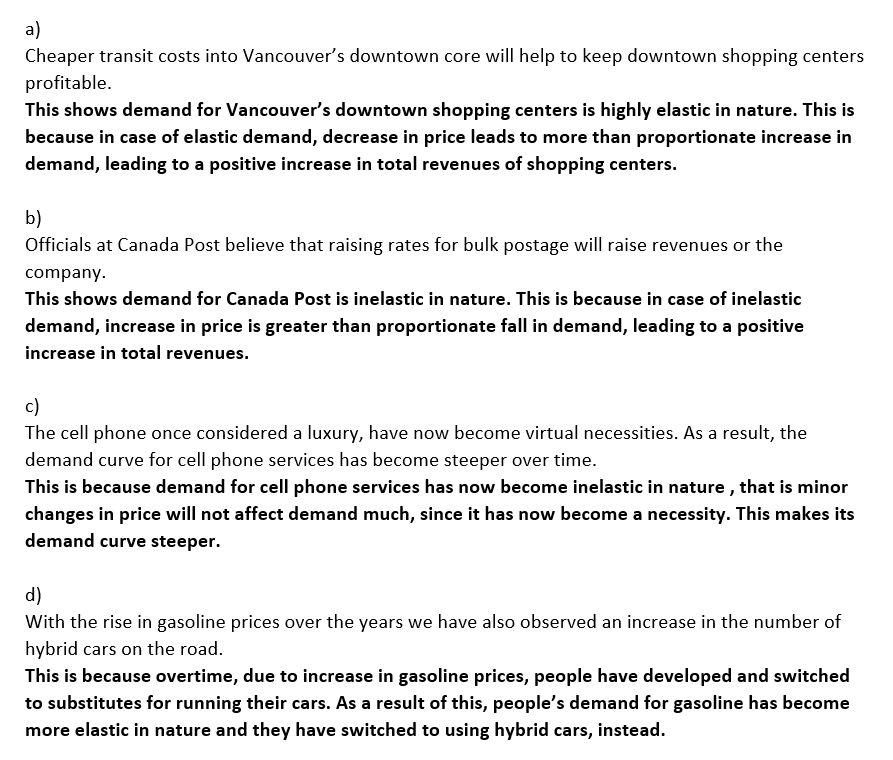
a)
Cheaper transit costs into Vancouver’s downtown core
will help to keep downtown
shopping centers profitable.
b)
Officials at Canada Post believe that raising rates
for bulk postage will raise revenues
for the company.
c)
The cell phone once considered a luxury, have now
become virtual necessities. As a
result, the demand curve for cell phone services has
become steeper over time.
d)
With the rise in gasoline prices over the years we
have also observed an increase in
the number of hybrid cars on the road.
Price
P
Q
E
Solutions
 Rahul Sunny answered 6 months ago
Related Solutions
The multiplier process depicted in the following table is based on an MPC of 0.75. a....
The multiplier
process depicted in the following table is based on an MPC of
0.75.
a. Recompute
the first four cycles using an MPC of 0.92.
MPC =
0.75
MPC =
0.92
Spending Cycles
Change in Spending during Cycle
Cumulative Increase in Spending
Change in Spending during Cycle
Cumulative Increase in Spending
(billions
per year)
(billions
per year)
(billions
per year)
(billions
per year)
1
$100.00
$100.00
$100.00
2
75.00
175.00
3
56.25
231.25
4
42.18
273.44
b. Given that...
The multiplier process depicted in the following table is based on an MPC of 0.75. a....
The multiplier process depicted in the
following table is based on an MPC of 0.75.
a. Recompute the first four cycles
using an MPC of 0.85.
MPC = 0.75
MPC = 0.85
Spending Cycles
Change in Spending during Cycle
Cumulative Increase in Spending
Change in Spending during Cycle
Cumulative Increase in Spending
(Billions per year)
(Billions per year)
(Billions per year)
(Billions per year)
1
$100.00
$100.00
$100
$100.00
2
75.00
175.00
________?
________?
3
56.25
231.25
________?
________?
4...
For each of the regions listed in the following table, use the midpoint method to identify...
4. Elastic, inelastic, and unit-elastic demand The following graph shows the demand for a good.For each of the regions listed in the following table, use the
midpoint method to identify if the demand for this good is elastic,
(approximately) unit elastic, or inelastic.RegionElasticInelasticUnit ElasticBetween W and XBetween Y and ZBetween X and YTrue or False: The value of the price elasticity of demand is
equal to the slope of the demand curve.TrueFalse
Explain the relationship between elasticity, total revenue, and marginal revenue. If you have a new product...
Explain the relationship between elasticity, total revenue, and
marginal revenue. If you have a new product in the market, will you
set the product price in the elastic or inelastic area? Why?
1. Go to the sources listed below and complete the following table. What can you conclude...
1. Go to the sources listed below and complete the following
table. What can you conclude from the table? Any of the rankings
surprise you? Explain your answer.
Table 1
Ranking
Best Country for Business (1)
Corruption Index 2017 (2)
Index of Economic Freedom 2018 (3)
1
2
3
4
5
6
7
8
9
10
Lowest
Table 2
Countries
Ranking of Best Countries for Business (1)
Ranking of Corruption Index 2017 (2)
Ranking of Index of Economic Freedom 2018...
You have 3 billion dollars in the fund, which you can invest in any combination of...
You have 3 billion dollars in the fund, which you can invest in
any combination of Australian stocks, US stocks, and Australian
Treasury. The idea is to use your knowledge of portfolio theory to
make an argument for having an internationally diversified
portfolio, rather than just holding domestic assets. The data are
monthly returns and the relevant sample statistics are summarized
in the following table:
Stock
E[R]
Var(R]
Cov(Aus, US)
Aus Index
0.00959
0.00222
0.00088
US Index
0.00727
0.00348
Aus...
1. What is the relationship between price elasticity of demand and total revenue? 2.You are the...
1. What is the relationship between price elasticity of demand
and total revenue?
2.You are the manager of a theater. At present the theater
charges the same admission price of $8 to all customers, regardless
of age. You propose a two-tier pricing scheme: $5 for children
under the age of 12 and $10 for adults. You tell your supervisor
that your proposal is likely to increase revenue. What must be true
about the price elasticity of demand if your proposal...
what is the pH of a solution following the combination of 245.0 mL of a 4.00*10^-3...
what is the pH of a solution following the combination of 245.0
mL of a 4.00*10^-3 M NaOH solution with 255.0 mL of a 2.33*10^-3 M
H2SO4 solution?
What is the relationship--if there is one--between the price elasticity of demand and the slope of...
What is the relationship--if there is one--between the price
elasticity of demand and the slope of the demand curve
3. What are the major determinants of price elasticity of demand? Use those determinants and your...
3. What are the major determinants of price elasticity of
demand? Use those determinants and your own reasoning in judging
whether demand for each of the following products is probably
elastic or inelastic: (a) bottled water; (b) toothpaste; (c) Crest
toothpaste; (d) ketchup; (e) diamond bracelets; (f) Microsoft
Windows operating system. LO4.1
6. How would the following changes in price affect total
revenue? That is, would total revenue increase, decrease, or remain
unchanged? LO4.2
Price falls and demand is inelastic....
ADVERTISEMENT
ADVERTISEMENT
Latest Questions
- 1 Which of the following overflow values clips all content that extends beyond the containing element’s...
- What are the key environmental and biological controls over decomposition rate in ecosystems?
- describe why independent oversight is important to taxpayers.
- Graph a Monopoly. Compare the price, quantity, and ATC of a monopoly with a perfectly competitive...
- Problem 18-12 Various shareholders' equity topics; comprehensive [LO18-1, 18-4, 18-5, 18-6, 18-7, 18-8] Part A In...
- Hello There, This is discussion Question For Advanced Database Systems Question: (a) Please define what a...
- Physicians at a clinic gave what they thought were drugs to 860860 patients. Although the doctors...
ADVERTISEMENT