Question
In: Math
A number of restaurants feature a device that allows credit card users to swipe their cards...
A number of restaurants feature a device that allows credit card users to swipe their cards at the table. It allows the user to specify a percentage or a dollar amount to leave as a tip. In an experiment to see how it works, a random sample of credit card users was drawn. Some paid the usual way, and some used the new device. The percent left as a tip was recorded and listed below. Using a = 0.05, what can we infer regarding users of the device?
| Usual | Device |
| 12.4 | 12.0 |
| 14.2 | 15.2 |
| 11.7 | 9.9 |
| 11.4 | 12.2 |
| 11.9 | 14.9 |
| 11.4 | 13.4 |
| 10.6 | 12.1 |
| 12.1 | 13.0 |
| 14.2 | 10.3 |
| 15.9 | 13.2 |
| 13.9 |
| a. |
There is statistically significant evidence to conclude that users of the device leave larger tips than customers who pay in the usual manner. |
|
| b. |
There is statistically significant evidence to conclude that users of the device leave smaller tips than customers who pay in the usual manner. |
|
| c. |
There is statistically significant evidence to conclude that users of the device and customers who pay in the usual manner do not differ in the percentage value of their tips. |
|
| d. |
There is insufficient statistical evidence to make any conclusions from this data. |
Solutions
Expert Solution
A number of restaurants feature a device that allows credit card users to swipe their cards at the table. It allows the user to specify a percentage or a dollar amount to leave as a tip. In an experiment to see how it works, a random sample of credit card users was drawn. Some paid the usual way, and some used the new device. The percent left as a tip was recorded and listed below. Using a = 0.05, what can we infer regarding users of the device?
|
a. |
There is statistically significant evidence to conclude that users of the device leave larger tips than customers who pay in the usual manner. |
|
|
b |
There is statistically significant evidence to conclude that users of the device leave smaller tips than customers who pay in the usual manner. |
|
|
Answer: c |
There is statistically significant evidence to conclude that users of the device and customers who pay in the usual manner do not differ in the percentage value of their tips. |
|
|
d |
There is insufficient statistical evidence to make any conclusions from this data. |

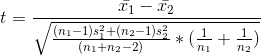
= 0.1100
DF = n1+n2-2 =19
Table value of t with 19 DF at 0.05 level = 2.0930
Rejection Region: Reject Ho if t < -2.0930 or t > 2.0930
Calculated t = 0.1100, not in the rejection region
The null hypothesis is not rejected.
|
Pooled-Variance t Test for the Difference Between Two Means |
|
|
(assumes equal population variances) |
|
|
Data |
|
|
Hypothesized Difference |
0 |
|
Level of Significance |
0.05 |
|
Population 1 Sample |
|
|
Sample Size |
11 |
|
Sample Mean |
12.7 |
|
Sample Standard Deviation |
1.6143 |
|
Population 2 Sample |
|
|
Sample Size |
10 |
|
Sample Mean |
12.62 |
|
Sample Standard Deviation |
1.7178 |
|
Intermediate Calculations |
|
|
Population 1 Sample Degrees of Freedom |
10 |
|
Population 2 Sample Degrees of Freedom |
9 |
|
Total Degrees of Freedom |
19 |
|
Pooled Variance |
2.7693 |
|
Standard Error |
0.7271 |
|
Difference in Sample Means |
0.0800 |
|
t Test Statistic |
0.1100 |
|
Two-Tail Test |
|
|
Lower Critical Value |
-2.0930 |
|
Upper Critical Value |
2.0930 |
|
p-Value |
0.9135 |
|
Do not reject the null hypothesis |
|
 milcah answered 6 months ago
Related Solutions
Recording credit card and debit card sales Restaurants do a large volume of business with credit and debit cards. Suppose Summer,
Credit Cards Credit card numbers follow patterns. Cards must have 13 - 16 digits (inclusive) Card...
Credit Card Number Check. The last digit of a credit card number is the check digit,...
Credit Card Number Check. The last digit of a credit card number is the check digit,...
Credit Card Number Check. The last digit of a credit card number is the check digit,...
Phoenix Restaurants accepts credit and debit cards as forms of payment. Assume Phoenix had $12,000 of credit and debit card sales on June 30, 2017.
2. TurboCard credit card company offers a loyalty program to its credit card users whereby the...
An individual has Centurion Card from American Express (credit cards). The credit card is most valuable...
FINDtwo different credit card applications (e.g., online, at restaurants, etc.). COMPAREthe two credit card offers by...
Credit card usage in the United States is substantial. Many startup companies use credit cards as...
- Teen Smoking Project CHAPTER 0. Preliminary Discussion Question: 1. What conjectures (educated guesses) could be made...
- In reviewing firm liquidity situations, lenders often count on the Quick Ratio (or Acid-Test ratio). Why...
- code a Java program that: Requests from the user for a text filename to read the...
- Discuss how the ARIES algorithm must operate under the circumstances that the system crashes during recovery
- (a) Based on the information in the above table, what is the unemployment rate? What is...
- Question 3 (a) What do you understand by a time series forecasting approach? Describe each of...
- 1 Which of the following overflow values clips all content that extends beyond the containing element’s...