Question
In: Economics
In 1995, Mexico maintained a fixed exchange rate regime relative to the US dollar. In the...
In 1995, Mexico maintained a fixed exchange rate regime relative to the US dollar. In the six months prior to the Mexican national elections in October 1995, the public debt increased by 30%.
a) Use the TB/Y diagram to explain the effects of the increase in public debt. Be specific; highlight the effect of changes in the trade balance and output.
b) Why do you think the Mexican debt increased? Use a graph.
Solutions
Expert Solution
Using the AA-DD model, we can assess the impact of rising public debt on the trade balance and the output/income.
AA-DD model reprents the equilibrium in the foreign exchange market, goods market and money market. AA curve (downward sloping curve) represents the asset market equilibrium from money market and foreign exchange market and DD curve (upward sloping curve) represent the goods amrket equilibrium. The intersection of the two gives the superequilibrium representing equilibium in all the three markets.
b) The debt in Mexcio might have increased because of the government's expanisionary fiscal policy measures- such as a tax cut or increased government spending or transfers considering the elections.
***************
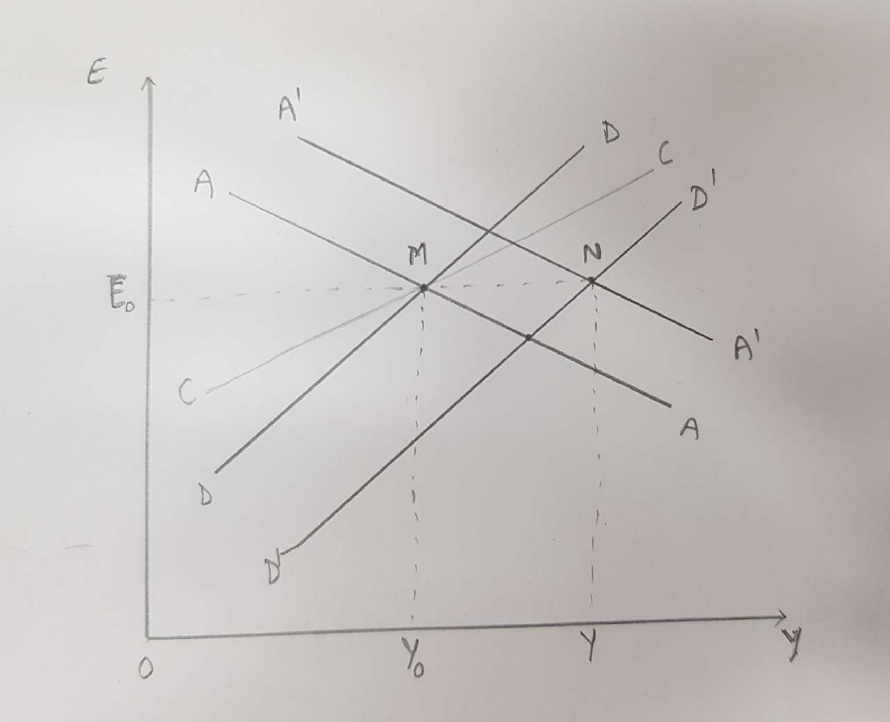
a) Suppose that the economy is initially at superequilibrium M with exchange rate E0 and output Y0. With the increase in government spending (owing to increased public debt), DD curve shifts rightward from DD to D'D' . This increases the aggregate demand and economy will move to the right of M, with increased output. The rise in output brings along a rise in demand for money, causing the interest rate in Mexico to rise. With higher iterest rates, the demand for mexican currency increases.
However, due to fixed exchange rate regime, the central bank intervenes and will supply the excess mexican currency causing the AA curve to shift rightward from AA to A'A'. This will happen untill the new superequilibrium is achieved at highr output and unaffected exchange rate (point N).
To conclude, the increased government spending because of the increased public debt results in increased poutput with no change in the exchange rate in the short run. However, since point N is below the CC curve, represents the current account balance to fall, corresponding to an incresed trade deficit.
 Rahul Sunny answered 7 months ago
Related Solutions
Fixed or Floating Exchange Rate Regime: Debate the relative merits of fixed and floating exchange rate...
Suppose that Mexico has a fixed exchange rate regime, and value of peso is fixed against...
Expilcate how the exchange rates , in a exchange rate regime and in a fixed exchange...
From 1995-2010, the real exchange rate between the Australian dollar and the U.S. dollar (measured...
Explain the difference between a fixed rate and a managed rate foreign exchange rate regime and...
Explain the difference between a fixed rate and a managed rate foreign exchange rate regime and...
ii) If the exchange rate of dollar stays fixed, how would this change affect us domestic...
Discuss the implications for the economy if Turkey moves on to a fixed exchange rate regime...
In a fixed exchange rate regime, an increase in the price level will cause which of...
6. Explain the difference between a fixed rate and a managed rate foreign exchange rate regime...
- Do you think that CAFTA will have a major impact on the U.S. economy? Why?
- Assignment 4, Fraction Comparable Instructions For this assignment, you will be updating the Fraction class from...
- what crystal claim that English is doing across the world?
- Site map for your e-commerce site. How many webpages this site has? What’s the name of...
- A skier of mass 60 kg starts at the top of a steep slope with an...
- If banks must hold $4 in reserves for each $10 in deposits, and the public decides...
- A 244 g mass is hung on a spring. As a result the spring stretches 20.5...