Question

In: Economics

Suppose a global recession is underway. Answer the following questions using the money market. (a) What...

Suppose a global recession is underway. Answer the following questions using the money market.

(a) What action will the Fed likely take? How will their interest rate target change? What action will they take to achieve their target?

(b) Using a graph of the money market, what happens on impact in response to that change in policy?

(c) How does the money market transition to the new equilibrium?

Solutions

Expert Solution

(a)

During recession, Fed will increase aggregate demand by increasing money supply. This is done by open market purchase of securities and/or by decreasing discount rate and/or by decreasing reserve ratio.

Increase in money supply will decrease interest rate.

(b)

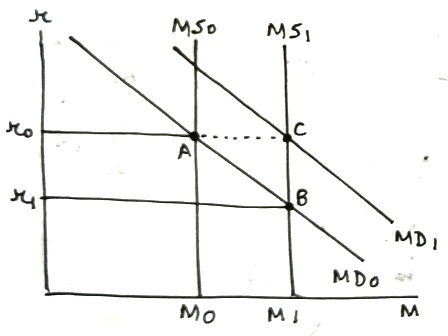
In following graph, MD0 and MS0 are initial money demand and supply curves, intersecting at point A with initial interest rate r0 and quantity of money M0. When money supply rises, MS0 shifts right to MS1, intersecting MD0 at point B with lower interest rate r1 and higher quantity of money M1.

(c)

In long run, higher interest rate will increase the demand for bonds and decrease the demand for money, shifting money demand curve to left until it intersects new money supply curve at original interest rate.

In above graph, MD0 will shift left to MD1, intersecting MS0 at point C with initial interest rate r0 and quantity of money M1.


Related Solutions

Use the money market and FX diagrams to answer the following questions.
Use the money market and FX diagrams to answer the following questions. This question considers the relationship between the Indian rupee (Rs) and the U.S. dollar ($). The exchange rate is in rupees per dollar, ERs/$. On all graphs, label the initial equilibrium point A.a. Illustrate how a permanent decrease in India’s money supply affects the money and FX markets. Label your short-run equilibrium point B and your long-run equilibrium point C. (1 mark)b. By plotting them on a chart...
Use the money market equilibrium and Foreign Exchange (Forex) market equilibrium to answer the following questions....
Use the money market equilibrium and Foreign Exchange (Forex) market equilibrium to answer the following questions. In the FX market diagram, the exchange rate is in U.S. dollars per British pound, (E$/£ ) and it is on the X-axis. Rates of return are on the Y-Axis. US Federal Reserve lowers money supply temporarily. a. What happens to the price level in the short run? b. Show the short run change in the US money market equilibrium using a diagram. c....
Use the money market equilibrium and Foreign Exchange (Forex) market equilibrium to answer the following questions....
Use the money market equilibrium and Foreign Exchange (Forex) market equilibrium to answer the following questions. In the FX market diagram, the exchange rate is in U.S. dollars per British pound, (E$/£ ) and it is on the X-axis. Rates of return are on the Y-Axis. US Federal Reserve announces its plans to permanently decrease its money supply but doesn’t actually implement this policy. a. What happens to the price level in the short run? b. Show the short run...
Use the money market equilibrium and Foreign Exchange (Forex) market equilibrium to answer the following questions....
Use the money market equilibrium and Foreign Exchange (Forex) market equilibrium to answer the following questions. In the FX market diagram, the exchange rate is in U.S. dollars per British pound, (E$/£ ) and it is on the X-axis. Rates of return are on the Y-Axis. US Federal Reserve announces its plans to permanently decrease its money supply but doesn’t actually implement this policy. v) Show the long run change in the US money market equilibrium using a diagram. vi)...
Use the money market equilibrium and Foreign Exchange (Forex) market equilibrium to answer the following questions....
Use the money market equilibrium and Foreign Exchange (Forex) market equilibrium to answer the following questions. In the FX market diagram, the exchange rate is in U.S. dollars per British pound, (E$/£ ) and it is on the X-axis. Rates of return are on the Y-Axis. i) What happens to the price level in the short run? d.US Federal Reserve announces its plans to permanently decrease its money supply but doesn’t actually implement this policy. ii) Show the short run...
Use the money market equilibrium and Foreign Exchange (Forex) market equilibrium to answer the following questions....
Use the money market equilibrium and Foreign Exchange (Forex) market equilibrium to answer the following questions. In the FX market diagram, the exchange rate is in U.S. dollars per British pound, (E$/£ ) and it is on the X-axis. Rates of return are on the Y-Axis. The US Federal Reserve lowers the money supply permanently. What happens to the price level in the short run? Show the short run change in the US money market equilibrium using a diagram. Describe...
Use the money market equilibrium and Foreign Exchange (Forex) market equilibrium to answer the following questions....
Use the money market equilibrium and Foreign Exchange (Forex) market equilibrium to answer the following questions. In the FX market diagram, the exchange rate is in U.S. dollars per British pound, (E$/£ ) and it is on the X-axis. Rates of return are on the Y-Axis. The US Federal Reserve lowers the money supply permanently. v) Show the long run change in the US money market equilibrium using a diagram. vi) Describe the long-run impact on interest rate and real...
Use the money market and FX diagrams to answer the following questions. This question considers the...
Use the money market and FX diagrams to answer the following questions. This question considers the relationship between the United States ($) and the British Pound (£). The exchange rate is in dollars per pound . On all graphs, label the initial equilibrium point A and label all your axes correctly. Illustrate how a temporary increase in the United States' money supply affects the money and FX markets. Label your short-run equilibrium point B and your long-run equilibrium point C....
Use the foreign exchange and money market diagrams to answer the following questions about the relationship...
Use the foreign exchange and money market diagrams to answer the following questions about the relationship between the Indian rupee (INR) and the Euro (EUR). Let the exchange rate be defined as rupees per yuan EINR/Eur. Suppose there is a fall in the Indian nominal money supply. Make the usual assumptions: UIP holds, PPP holds in the long run, prices are sticky in the short run, (20p) . Assume first that the fall in money supply is temporary (so that...
Use the money market and FX diagrams to answer the following questions about the relationship between...
Use the money market and FX diagrams to answer the following questions about the relationship between the Home and the foreign currency (Eh/f: home in terms of foreign; per unit (1) foreign currency). Consider how a change in foreign Money supply affects interest rates and exchange rates. On all graphs, label the initial equilibrium point A. a) Illustrate graphically how a temporary decrease in the foreign Money supply affects the money and FX markets in the short run and in...
ADVERTISEMENT
ADVERTISEMENT
ADVERTISEMENT