Question
In: Finance
Consider the two (excess return) index-model regression results for stocks A and B. The risk-free rate...
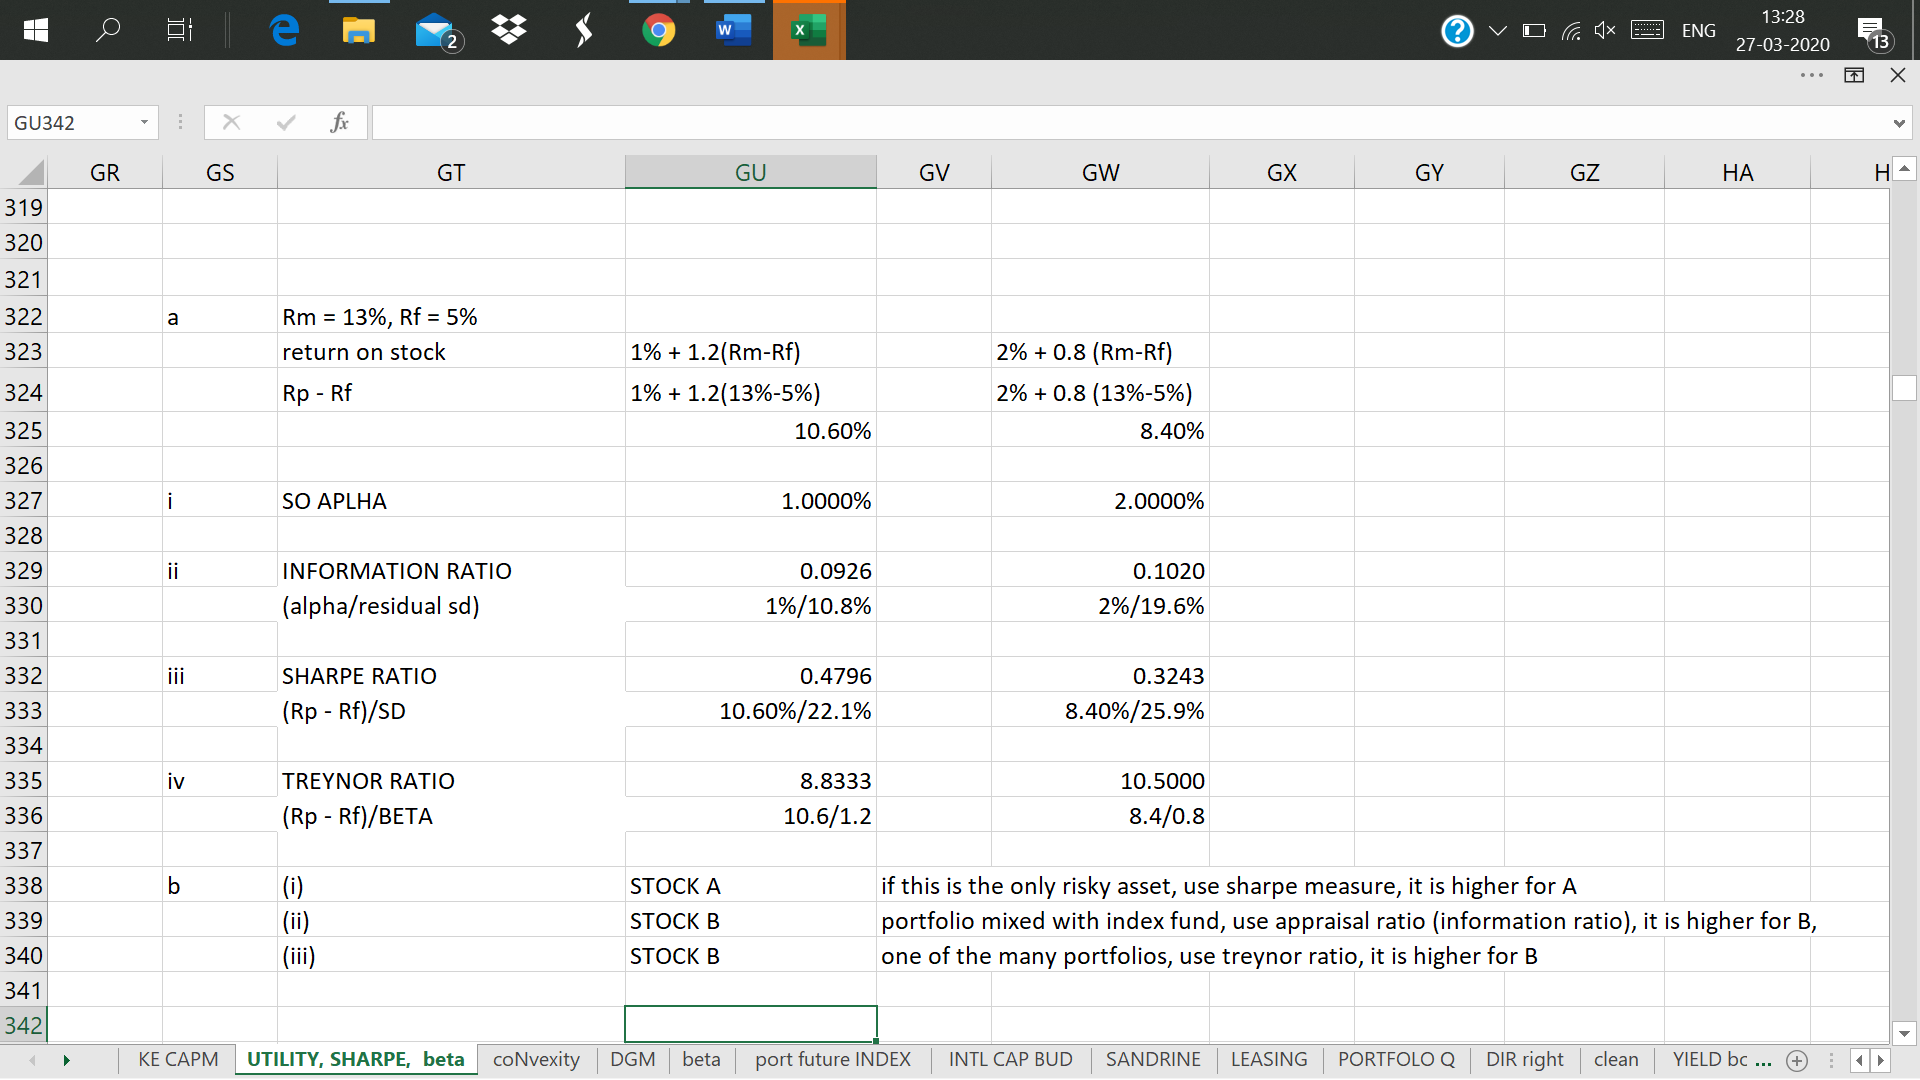
Consider the two (excess return) index-model regression results for stocks A and B. The risk-free rate over the period was 5%, and the market’s average return was 13%. Performance is measured using an index model regression on excess returns. Stock A Stock B Index model regression estimates 1% + 1.2(rM − rf) 2% + 0.8(rM − rf) R-square 0.605 0.451 Residual standard deviation, σ(e) 10.8% 19.6% Standard deviation of excess returns 22.1% 25.9% a. Calculate the following statistics for each stock: (Round your answers to 4 decimal places.) b. Which stock is the best choice under the following circumstances?
Solutions
Expert Solution
SEE THE IMAGE. ANY DOUBTS, FEEL FREE TO ASK. THUMBS UP PLEASE
 jeff jeffy answered 9 months ago
Related Solutions
Consider the two (excess return) index-model regression results for stocks A and B. The risk-free rate...
Consider the two (excess return) index-model regression results
for stocks A and B. The risk-free rate over the
period was 8%, and the market’s average return was 14%. Performance
is measured using an index model regression on excess returns.
Stock A
Stock B
Index model regression estimates
1% + 1.2(rM − rf)
2% + 0.8(rM − rf)
R-square
0.665
0.481
Residual standard deviation, σ(e)
11.8%
20.6%
Standard deviation of excess returns
23.1%
27.9%
a. Calculate the following statistics for each...
Consider the two (excess return) index-model regression results for stocks A and B. The risk-free rate...
Consider the two (excess return) index-model regression results
for stocks A and B. The risk-free rate over the
period was 7%, and the market’s average return was 14%. Performance
is measured using an index model regression on excess returns.
Stock
A
Stock
B
Index model
regression estimates
1% +
1.2(rM − rf)
2% +
0.8(rM − rf)
R-square
0.635
0.466
Residual
standard deviation, σ(e)
11.3%
20.1%
Standard
deviation of excess returns
22.6%
26.9%
a. Calculate the following statistics for each...
Consider the two (excess return) index-model regression results for stocks A and B. The risk-free rate...
Consider the two (excess return) index-model regression results
for stocks A and B. The risk-free rate over the
period was 7%, and the market’s average return was 15%. Performance
is measured using an index model regression on excess returns.
Stock A
Stock B
Index model regression estimates
1% + 1.2(rM − rf)
2% + 0.8(rM − rf)
R-square
0.641
0.469
Residual standard deviation, σ(e)
11.4%
20.2%
Standard deviation of excess returns
22.7%
27.1%
a. Calculate the following statistics for each...
Consider the two (excess return) index-model regression results for stocks A and B. The risk-free rate...
Consider the two (excess return) index-model regression results
for stocks A and B. The risk-free rate over the
period was 6%, and the market’s average return was 15%. Performance
is measured using an index model regression on excess returns.
Stock A
Stock B
Index model regression estimates
1% + 1.2(rM − rf)
2% + 0.8(rM − rf)
R-square
0.594
0.445
Residual standard deviation, σ(e)
10.6%
19.4%
Standard deviation of excess returns
21.9%
25.5%
a. Calculate the following statistics for each...
Consider the two (excess return) index-model regression results for stocks A and B. The risk-free rate...
Consider the two (excess return) index-model regression results
for stocks A and B. The risk-free rate over the
period was 5%, and the market’s average return was 14%. Performance
is measured using an index model regression on excess returns.
Stock A
Stock B
Index model regression estimates
1% + 1.2(rM − rf)
2% + 0.8(rM − rf)
R-square
0.611
0.454
Residual standard deviation, σ(e)
10.9%
19.7%
Standard deviation of excess returns
22.2%
26.1%
a. Calculate the following statistics for each...
Consider the two (excess return) index-model regression results for stocks A and B. The risk-free rate...
Consider the two (excess return) index-model regression results
for stocks A and B. The risk-free rate over the
period was 4%, and the market’s average return was 12%. Performance
is measured using an index model regression on excess returns.
Stock
A
Stock
B
Index model
regression estimates
1% +
1.2(rM − rf)
2% +
0.8(rM − rf)
R-square
0.689
0.493
Residual
standard deviation, σ(e)
12.2%
21%
Standard
deviation of excess returns
23.5%
28.7%
a. Calculate the following statistics for each...
Consider the two (excess return) index-model regression results for stocks A and B. The risk-free rate...
Consider the two (excess return) index-model regression results
for stocks A and B. The risk-free rate over the
period was 8%, and the market’s average return was 12%. Performance
is measured using an index model regression on excess returns.
Stock A
Stock B
Index model regression estimates
1% + 1.2(rM − rf)
2% + 0.8(rM − rf)
R-square
0.653
0.475
Residual standard deviation, σ(e)
11.6%
20.4%
Standard deviation of excess returns
22.9%
27.5%
a. Calculate the following statistics for each...
Problem 24-9 Consider the two (excess return) index-model regression results for stocks A and B. The...
Problem 24-9
Consider the two (excess return) index-model regression results
for stocks A and B. The risk-free rate over the
period was 5%, and the market’s average return was 15%. Performance
is measured using an index model regression on excess returns.
Stock
A
Stock
B
Index model regression
estimates
1% +
1.2(rM ? rf)
2% +
0.8(rM ? rf)
R-square
0.617
0.457
Residual standard deviation,
?(e)
11%
19.8%
Standard deviation of excess
returns
22.3%
26.3%
a. Calculate the following statistics...
Consider the two (excess return) index model regression results for A and B: RA = –1.8%...
Consider the two (excess return) index model regression results
for A and B:
RA = –1.8% + 2RM
R-square = 0.640
Residual standard deviation = 12.6%
RB = 1.4% + 1RM
R-square = 0.590
Residual standard deviation = 11.4%
If rf were constant at 6% and the regression
had been run using total rather than excess returns, what would
have been the regression intercept for stock A?
(Negative value should be indicated by a minus sign. Round
your answer to...
Consider the two (excess return) index model regression results for stock A and B RA =...
Consider the two (excess return) index model regression results
for stock A and B RA = 0.01 + 1.2RM R2 of 0.576; Std deviation of
error term of 10.3% RB = -0.02 + 0.8RM R2 of 0.436; Std deviation
of error term of 9.1%
a) Which stock has more firm-specific risk? Explain [4
points]
b) Which has greater market risk? Explain [4 points]
c) For which stock does market movement explain a grater
fraction of return variability? Explain [4 points]...
ADVERTISEMENT
ADVERTISEMENT
Latest Questions
- Based on what you learned in this module, identify one person who you believe possesses primarily...
- An Auditor may decide to make use of a specialist in obtaining sufficient appropriate audit evidence...
- Dirac's Theorem states that "A simple graph with n vertices (n >= 3) is Hamiltonian if...
- Two 10-cm-diameter charged rings face each other, 15cm apart. The left ring is charged to -29nC...
- Under what conditions would it be possible for an excise tax to have no efficiency cost...
- explain the difference between activities and financial statements of service businesses and merchandising businesses.
- 2. Compare and compare the matrix multiplication algorithm and the Floyd-Warshall algorithm to find all pairs...
ADVERTISEMENT