Question
In: Economics
Please answer in detail with every step along with the graph which is required for question...
Please answer in detail with every step along with the graph which is required for question bit C.
The table below shows hypothetical values, in billions of dollars, of different forms of money.
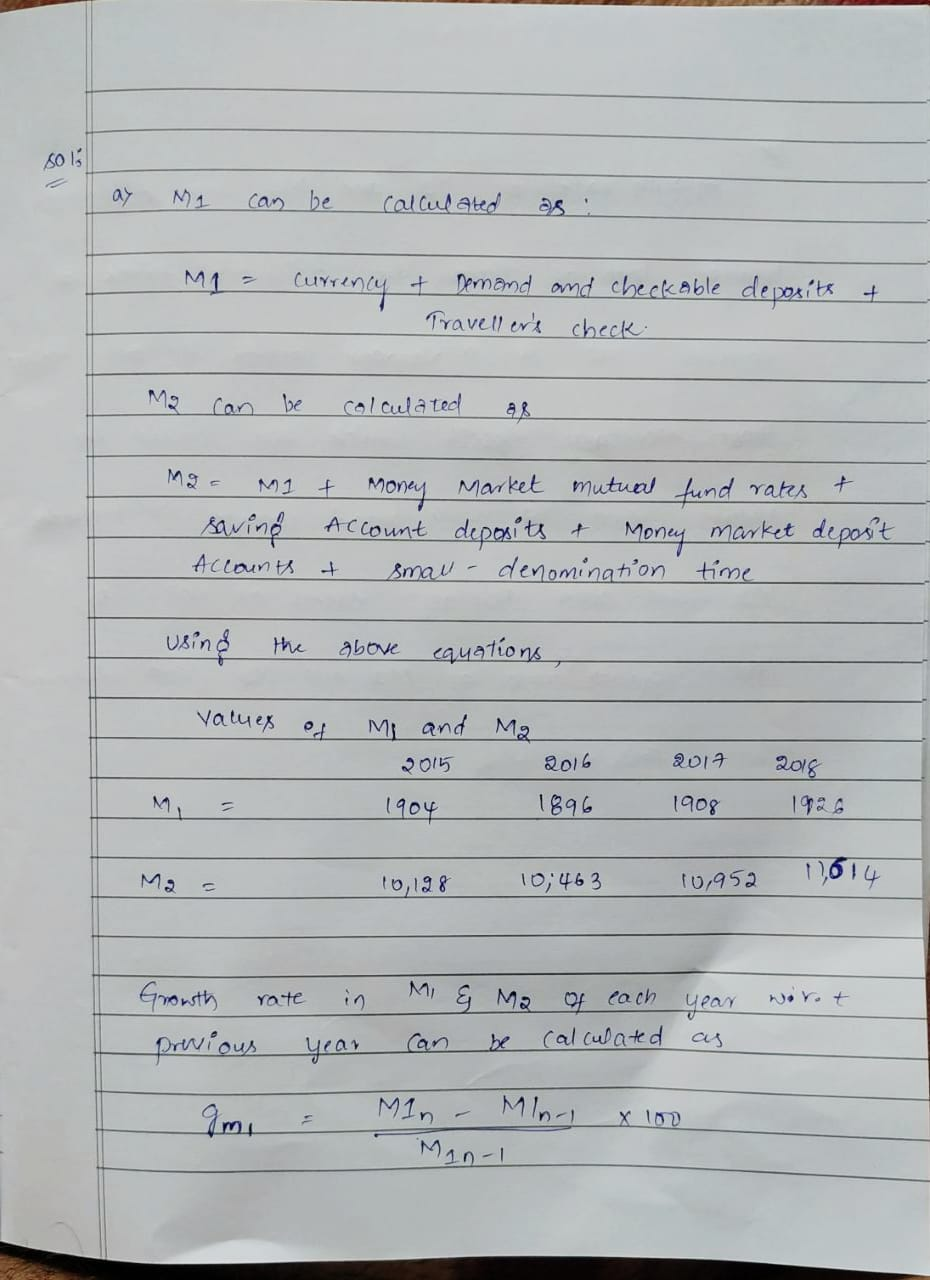
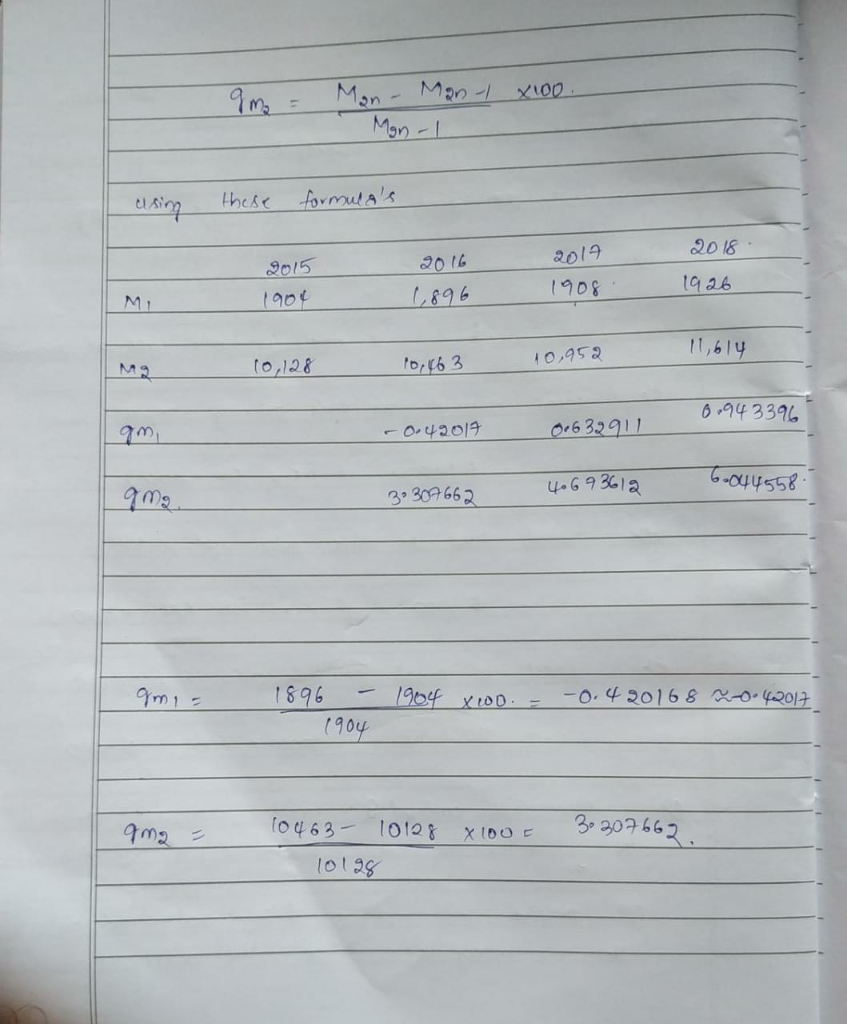
a. Use the table to calculate the M1 and M2 money supplies for each year, as well as the growth rates of the M1 and M2 money supplies from the previous year.
b. Why are the growth rates of M1 and M2 so different? Explain.
|
2015 |
2016 |
2017 |
2018 |
||
|
A. |
Currency |
900 |
920 |
925 |
931 |
|
B. |
Money market mutual fund shares |
680 |
681 |
679 |
688 |
|
C. |
Saving account deposits |
5,500 |
5,780 |
5,968 |
6,105 |
|
D. |
Money market deposit accounts |
1,214 |
1,245 |
1,274 |
1,329 |
|
E. |
Demand and checkable deposits |
1,000 |
972 |
980 |
993 |
|
F. |
Small denomination time deposits |
830 |
861 |
1,123 |
1,566 |
|
G. |
Traveler’s checks |
4 |
4 |
3 |
2 |
|
H. |
3-month treasury bills |
1,986 |
2,374 |
2,436 |
2,502 |
c. Go to the web site of the St. Louis Federal Reserve Bank FRED database and graph the (year-over-year) growth rates of M1 and M2 for the sample period 1998-2018. Show your graph in your submission.
Solutions
 Rahul Sunny answered 8 months ago
Related Solutions
Please evaluate this question with every detail step and explanation. (No computer output is accepted) The...
Please evaluate the question with every detail step and explanation. (No computer output is accepted) The...
please prove this problem step by step. thanks Prove that in every simple graph there is...
please answer the question by explaining the step by step process used in the calculation. and...
For every question, please write down each main step before you obtain the final answer. Correct...
For every question, please write down each main step before you obtain the final answer. Correct...
Please evaluate these question with every step and every explanation for each of one. Lef f(x)=...
Please answer with detail : define diversity along with some of the key components of diversification...
PLEASE BE VERY SPECIFIC AND SHOW EVERY SINGLE STEP IN DETAIL, SPECIALLY IF USING R PROGRAM....
Please answer the last step for question 1. Answer it asap please. Thanks 1. Consider the...
- in your own opinion, It has been said that a smartphone is a computer in your...
- Use the internet to read more about journaling file systems such as NTFS, extfs2, and extfs3....
- Consider the quick sort algorithm. The quick sort algorithm is a divide and conquer approach which...
- Tesla 1. How to make these weaknesses into strengths? Burn through cash, high prices, bottlenecking/product delays,...
- Assignment # 12: Email Presentation Learning Objectives and Outcomes Design a PowerPoint presentation appropriate for middle...
- Identify which of the perspectives you believe is the BEST for accurately explaining human behavior and...
- What trade policies should a country adopt? why? Explain. Also, find some reference materials on this...