Question
In: Economics
1. Suppose a firm pays labor (L) a wage rate (w) of $10 and capital (K)...
1.
Suppose a firm pays labor (L) a wage rate (w) of $10 and capital (K) a rental rate (r) of $25.
A.
Write an equation for the isocost line and find i
ts slope. Then, draw a graph (with Labor on
the horizontal axis) of the isocost lines for Total Costs of $200 and $300.
B.
Suppose a firm wants to produce 200 units and can do so with the following combinations of
labor and capital
:
(5 L, 10 K); (10 L, 4 K
)
;
or (25 L, 2 K).
Using this information, o
n the same
graph as Part (A), draw
an approximate
isoquant for 200 units, making sure to show the
cost
-
minimizing output choice.
Solutions
Expert Solution
A)
Given
Wage rate=w=$10
Capital Rent=r=$25
Isocost line is given by
C=wL+rK
C=10L+25*K (Equation of isocost line)
On rearranging we get
25K=C-10L
K=0.04C-0.4L
Comparing with general equation of line i.e. y=mx+c, we can say that slope of isocost line is -0.40.
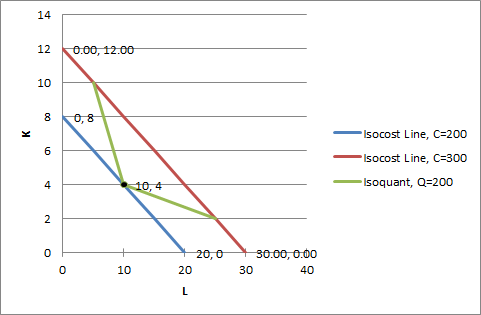
Let us draw isocost lines for C=200 and 300
In case of C=200, We can develop the following schedule
| L | K=0.04*200-0.4*L |
| 0 | 8 |
| 5 | 6 |
| 10 | 4 |
| 15 | 2 |
| 20 | 0 |
In case of C=300, We can develop the following schedule
| L | K=0.04*300-0.4*L |
| 0.00 | 12.00 |
| 5.00 | 10.00 |
| 10.00 | 8.00 |
| 15.00 | 6.00 |
| 20.00 | 4.00 |
| 25.00 | 2.00 |
| 30.00 | 0.00 |
b)
For Q=200, We can use the given schedule to draw isoquant curve
| L | K |
| 5 | 10 |
| 10 | 4 |
| 25 | 2 |
We can see that isocost line (C=200) is tangent to isoquant line (Q=200) at L=10 and K=4
It represents the cost minimizing input combination.
Minimum Cost is $200
 Rahul Sunny answered 8 months ago
Related Solutions
A firm produces output using capital (K) and labor (L). Capital and labor are perfect complements...
Suppose that a firm uses labour and capital in production. The wage rate is $10 per...
Question 1 Consider the production function:F(L,K) = L^1/3 K^1/3 . Suppose the wage rate (price per...
Suppose your firm uses 2 inputs to produce its output: K (capital) and L (labor). the...
Suppose you are in the photocopying business, and are using labor (L) and capital (K), in...
There is a firm who manufacturers and uses capital (K) and labor (L) to product output...
A firm discovers that when it uses K units of capital and L units of labor...
A firm discovers that when it uses K units of capital and L units of labor...
1a. The production function for computers is q(K,L) = 7K1/3L2 where K=capital and L=labor. A firm...
Imagine a firm that only uses capital (K) and labor (L). Use an isocost / isoquant...
- Students performed a procedure similar to Part III of this experiment (Analyzing a Vitamin Supplement for...
- The output of the function is a dictionary whose keys represent the bins and whose values...
- The shape of a graph of a binomial distribution depends on the value of both n...
- In 2012, cost per Medicare beneficiary did what?
- 3. A. What techniques can a firm use to optimize demand deposit holdings? B. How do...
- The half-life of mercury-197 is 64.1 hours. If a patient undergoing a kidney scan is given...
- Double bonds react with Br2 to form a dibromide. Isobutylene undergoes cationic polymerization under conditions where...