Question
In: Other
What is the effect of the BOD coefficient (i.e., the biodegradability of the waste in the...
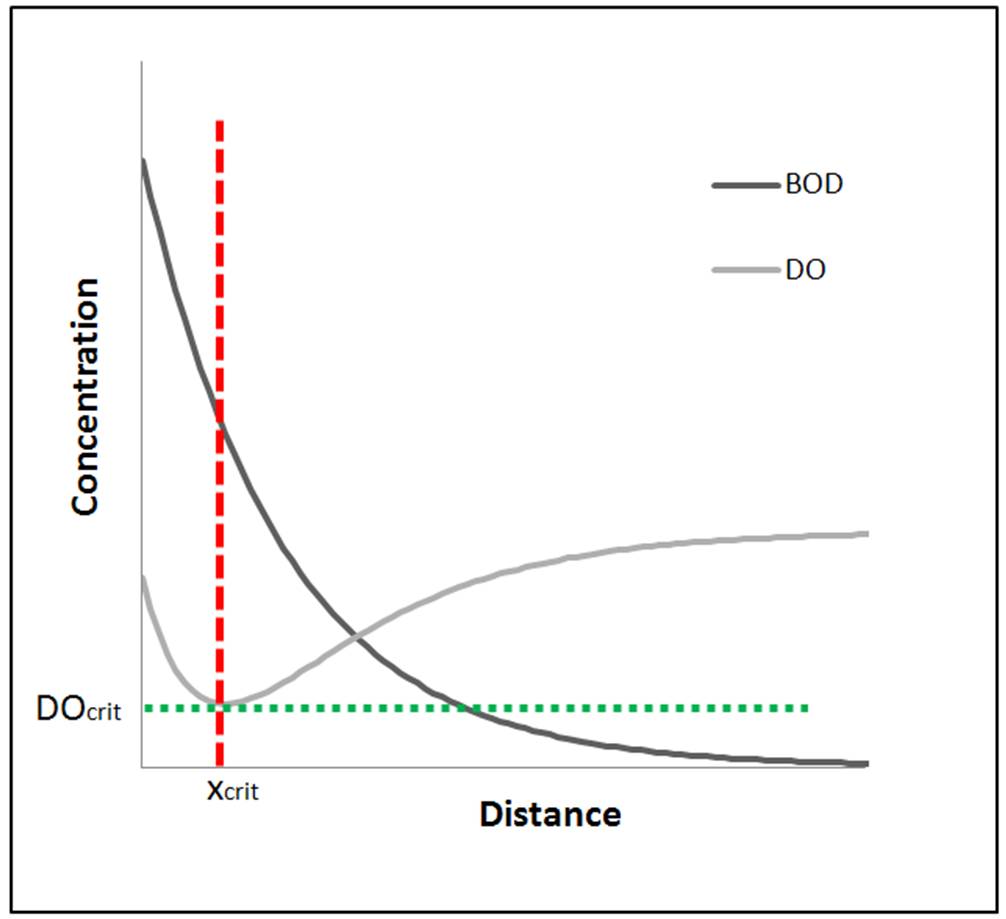
What is the effect of the BOD coefficient (i.e., the biodegradability of the waste in the effluent) on the shape of the DO sag curve?
Solutions
Expert Solution
Microorganisms such as bacteria are responsible for decomposing organic waste. When organic matter such as dead plants, leaves, grass clippings, manure, sewage, or even food waste is present in a water supply, the bacteria will begin the process of breaking down this waste. When this happens, much of the available dissolved oxygen is consumed by aerobic bacteria, robbing other aquatic organisms of the oxygen they need to live. Biological Oxygen Demand (BOD) is a measure of the oxygen used by microorganisms to decompose this waste. If there is a large quantity of organic waste in the water supply, there will also be a lot of bacteria present working to decompose this waste. In this case, the demand for oxygen will be high (due to all the bacteria) so the BOD level will be high. As the waste is consumed or dispersed through the water, BOD levels will begin to decline. Nitrates and phosphates in a body of water can contribute to high BOD levels. Nitrates and phosphates are plant nutrients and can cause plant life and algae to grow quickly. When plants grow quickly, they also die quickly. This contributes to the organic waste in the water, which is then decomposed by bacteria. This results in a high BOD level. When BOD levels are high, dissolved oxygen (DO) levels decrease because the oxygen that is available in the water is being consumed by the bacteria. Since less dissolved oxygen is available in the water, fish and other aquatic organisms may not survive.
 Source: Wikipedia
 The DO in the stream may not be
at saturation level and there may be initial oxygen deficit ‘Do’.
At this stage, when the effluent with initial BOD load Lo, is
discharged in to stream, the DO content of the stream starts
depleting and the oxygen deficit (D) increases. The variation of
oxygen deficit (D) with the distance along the stream, and hence
with the time of flow from the point of pollution is depicted by
the ‘Oxygen Sag Curve’. The major point in sag analysis is point of
minimum DO, i.e., maximum deficit. The maximum or critical deficit
(Dc) occurs at the inflexion points of the oxygen sag curve.
Related Solutions
Why do COD and BOD measurements give different result for same waste?
Biochemical oxygen demand i.e. BOD) is a measure of the potential damage that can be done...
What is the effect of transpiration on the surface tension of the water, i.e. does it...
1. Define BOD. Describe the measurement of BOD. Give an estimate of possible BOD values for...
Explain what a meta-analysis is (i.e., what is a meta-analysis in terms of effect sizes).
consider spherical aberration. Describe 1. the effect of the abberation (i.e. what happens to an image)...
Assume that a firm produces organic waste that has the effect of increasing the fertility of...
What is the coefficient of ?
1. what is thet typical measure that is used for BOD? 2. What is added to...
Under what conditions can the phi-coefficient be used to measure effect size for a chi-square test...
- 2. a. Choose all of the following that apply to DynamoDB: (a) DynamoDB is part of...
- I asked this question before, but I'm wondering if there are any other ways to do...
- Can you please Describe your actions as the Manager, and how you would manage the project...
- Suppose we have a collection of n different subsets of the set { 1, 2, ...,...
- def read_list(): """ This function should ask the user for a series of integer values (until...
- If two slits are separated by .25cm and the slit to screen is 1m, what is...
- Determine the oxidation number (oxidation state) for the indicated element in each of the following compounds....
 Amanda K answered 3 years ago